Exhibit 99.1 INVESTOR PRESENTATION May 2019Exhibit 99.1 INVESTOR PRESENTATION May 2019
LEGAL DISCLAIMER Forward-Looking Statements Some of the information contained in this presentation constitutes “forward-looking statements”. Forward-looking statements can be identified by words such as “anticipates,” “intends,” “plans,” “seeks,” “believes,” “estimates,” “expects,” “projects” and similar references to future periods. Forward-looking statements are based on our current expectations and assumptions regarding our business, the economy and other future conditions. Because forward-looking statements relate to the future, they are subject to inherent uncertainties, risks and changes in circumstances that are difficult to predict. Examples of forward looking statements include, but are not limited to, statements regarding our results of operations, financial condition, liquidity, prospects, growth, strategies, product and service offerings and 2019 outlook. Our actual results may differ materially from those contemplated by the forward-looking statements. We caution you, therefore, against relying on any of these forward-looking statements. They are neither statements of historical fact nor guarantees or assurances of future performance. Important factors that could cause actual results to differ materially from those in the forward-looking statements include, but are not limited to, regional, national or global political, economic, business, competitive, market and regulatory conditions, currency exchange rates and other factors, including those described in the sections titled “Risk Factors” and “Management Discussion & Analysis of Financial Condition and Results of Operations” in our filings with the SEC, which are available on the SEC’s website at www.sec.gov. Any forward-looking statement made by us in this presentation, the conference call during which this presentation is reviewed and any discussions that follow speaks only as of the date on which it is made. Factors or events that could cause our actual results to differ may emerge from time to time, and it is not possible for us to predict all of them. We undertake no obligation to update any forward-looking statement, whether as a result of new information, future developments or otherwise, except as may be required by applicable law. Certain supply share statistics included in this presentation, including our estimated supply share positions, are based on management estimates. Non-GAAP Financial Measures This presentation includes certain non-GAAP financial measures, including adjusted EBITDA, adjusted EBITDA margin and adjusted free cash flow which are provided to assist in an understanding of our business and its performance. These non-GAAP financial measures should be considered only as supplemental to, and not as superior to, financial measures prepared in accordance with GAAP. Non-GAAP financial measures should be read only in conjunction with consolidated financials prepared in accordance with GAAP. Reconciliations of non- GAAP measures to the relevant GAAP measures are provided in the appendix of this presentation. The Company is not able to provide a reconciliation of the Company’s non-GAAP financial guidance to the corresponding GAAP measures without unreasonable effort because of the inherent difficulty in forecasting and quantifying certain amounts necessary for such a reconciliation such as certain non-cash, nonrecurring or other items, including transaction and restructuring related items, that are included in net income and EBITDA as well as the related tax impacts of these items and asset dispositions/acquisitions and changes in foreign currency exchange rates that are included in cash flow, due to the uncertainty and variability of the nature and amount of these future charges and costs. Non-GAAP Financial Measures – Business Combination On May 4, 2016, we consummated a series of transactions (the Business Combination ) to reorganize and combine the businesses of PQ Holdings Inc. and Eco Services Operations LLC under a new holding company, PQ Group Holdings Inc. In this presentation, we present pro forma information for the years ended December 31, 2016 and 2015, which gives effect to the Business Combination and the related financing transactions as if they occurred on January 1, 2015. Such information is illustrative and not intended to represent what our results of operations would have been had the Business Combination and related financing transactions occurred at any time prior to May 4, 2016 or to project our results of operations for any future period. Such information may not be comparable to, or indicative of, future performance. Zeolyst Joint Venture Zeolyst International and Zeolyst C.V. (our 50% owned joint ventures that we refer to collectively as our “Zeolyst Joint Venture”) are accounted for as an equity method investment in accordance with GAAP. The presentation of our Zeolyst Joint Venture’s sales in this presentation represents 50% of the sales of our Zeolyst Joint Venture. We do not record sales by our Zeolyst Joint Venture as revenue and such sales are not consolidated within our results of operations. However, our Adjusted EBITDA reflects our share of the earnings of our Zeolyst Joint Venture that have been recorded as equity in net income from affiliated companies in our consolidated statements of income for such periods and includes Zeolyst Joint Venture adjustments on a proportionate basis based on our 50% ownership interest. Accordingly, our Adjusted EBITDA margins are calculated including 50% of the sales of our Zeolyst Joint Venture for the relevant periods in the denominator. 2LEGAL DISCLAIMER Forward-Looking Statements Some of the information contained in this presentation constitutes “forward-looking statements”. Forward-looking statements can be identified by words such as “anticipates,” “intends,” “plans,” “seeks,” “believes,” “estimates,” “expects,” “projects” and similar references to future periods. Forward-looking statements are based on our current expectations and assumptions regarding our business, the economy and other future conditions. Because forward-looking statements relate to the future, they are subject to inherent uncertainties, risks and changes in circumstances that are difficult to predict. Examples of forward looking statements include, but are not limited to, statements regarding our results of operations, financial condition, liquidity, prospects, growth, strategies, product and service offerings and 2019 outlook. Our actual results may differ materially from those contemplated by the forward-looking statements. We caution you, therefore, against relying on any of these forward-looking statements. They are neither statements of historical fact nor guarantees or assurances of future performance. Important factors that could cause actual results to differ materially from those in the forward-looking statements include, but are not limited to, regional, national or global political, economic, business, competitive, market and regulatory conditions, currency exchange rates and other factors, including those described in the sections titled “Risk Factors” and “Management Discussion & Analysis of Financial Condition and Results of Operations” in our filings with the SEC, which are available on the SEC’s website at www.sec.gov. Any forward-looking statement made by us in this presentation, the conference call during which this presentation is reviewed and any discussions that follow speaks only as of the date on which it is made. Factors or events that could cause our actual results to differ may emerge from time to time, and it is not possible for us to predict all of them. We undertake no obligation to update any forward-looking statement, whether as a result of new information, future developments or otherwise, except as may be required by applicable law. Certain supply share statistics included in this presentation, including our estimated supply share positions, are based on management estimates. Non-GAAP Financial Measures This presentation includes certain non-GAAP financial measures, including adjusted EBITDA, adjusted EBITDA margin and adjusted free cash flow which are provided to assist in an understanding of our business and its performance. These non-GAAP financial measures should be considered only as supplemental to, and not as superior to, financial measures prepared in accordance with GAAP. Non-GAAP financial measures should be read only in conjunction with consolidated financials prepared in accordance with GAAP. Reconciliations of non- GAAP measures to the relevant GAAP measures are provided in the appendix of this presentation. The Company is not able to provide a reconciliation of the Company’s non-GAAP financial guidance to the corresponding GAAP measures without unreasonable effort because of the inherent difficulty in forecasting and quantifying certain amounts necessary for such a reconciliation such as certain non-cash, nonrecurring or other items, including transaction and restructuring related items, that are included in net income and EBITDA as well as the related tax impacts of these items and asset dispositions/acquisitions and changes in foreign currency exchange rates that are included in cash flow, due to the uncertainty and variability of the nature and amount of these future charges and costs. Non-GAAP Financial Measures – Business Combination On May 4, 2016, we consummated a series of transactions (the Business Combination ) to reorganize and combine the businesses of PQ Holdings Inc. and Eco Services Operations LLC under a new holding company, PQ Group Holdings Inc. In this presentation, we present pro forma information for the years ended December 31, 2016 and 2015, which gives effect to the Business Combination and the related financing transactions as if they occurred on January 1, 2015. Such information is illustrative and not intended to represent what our results of operations would have been had the Business Combination and related financing transactions occurred at any time prior to May 4, 2016 or to project our results of operations for any future period. Such information may not be comparable to, or indicative of, future performance. Zeolyst Joint Venture Zeolyst International and Zeolyst C.V. (our 50% owned joint ventures that we refer to collectively as our “Zeolyst Joint Venture”) are accounted for as an equity method investment in accordance with GAAP. The presentation of our Zeolyst Joint Venture’s sales in this presentation represents 50% of the sales of our Zeolyst Joint Venture. We do not record sales by our Zeolyst Joint Venture as revenue and such sales are not consolidated within our results of operations. However, our Adjusted EBITDA reflects our share of the earnings of our Zeolyst Joint Venture that have been recorded as equity in net income from affiliated companies in our consolidated statements of income for such periods and includes Zeolyst Joint Venture adjustments on a proportionate basis based on our 50% ownership interest. Accordingly, our Adjusted EBITDA margins are calculated including 50% of the sales of our Zeolyst Joint Venture for the relevant periods in the denominator. 2
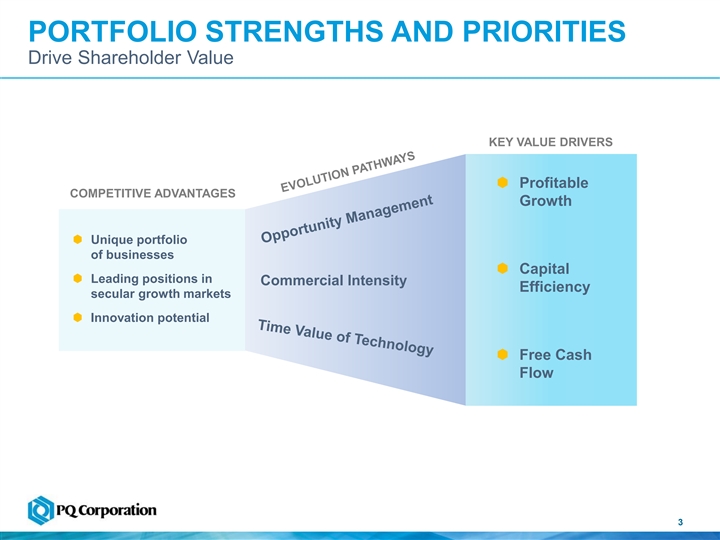
PORTFOLIO STRENGTHS AND PRIORITIES Drive Shareholder Value KEY VALUE DRIVERS Profitable COMPETITIVE ADVANTAGES Growth Unique portfolio of businesses Capital Leading positions in Commercial Intensity Efficiency secular growth markets Innovation potential Free Cash Flow 3PORTFOLIO STRENGTHS AND PRIORITIES Drive Shareholder Value KEY VALUE DRIVERS Profitable COMPETITIVE ADVANTAGES Growth Unique portfolio of businesses Capital Leading positions in Commercial Intensity Efficiency secular growth markets Innovation potential Free Cash Flow 3
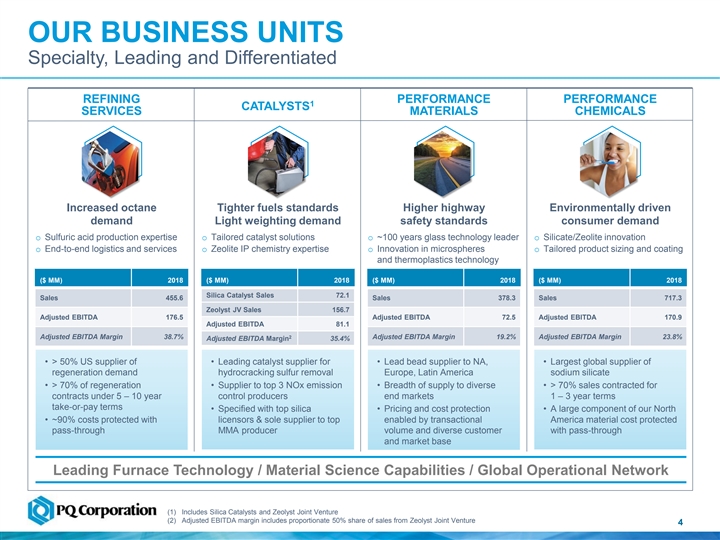
OUR BUSINESS UNITS Specialty, Leading and Differentiated REFINING PERFORMANCE PERFORMANCE 1 CATALYSTS SERVICES MATERIALS CHEMICALS Increased octane Tighter fuels standards Higher highway Environmentally driven demand Light weighting demand safety standards consumer demand o Sulfuric acid production expertise o Tailored catalyst solutions o ~100 years glass technology leader o Silicate/Zeolite innovation o End-to-end logistics and services o Zeolite IP chemistry expertise o Innovation in microspheres o Tailored product sizing and coating and thermoplastics technology ($ MM) 2018 ($ MM) 2018 ($ MM) 2018 ($ MM) 2018 Silica Catalyst Sales 72.1 Sales 455.6 Sales 378.3 Sales 717.3 Zeolyst JV Sales 156.7 Adjusted EBITDA 176.5 Adjusted EBITDA 72.5 Adjusted EBITDA 170.9 Adjusted EBITDA 81.1 Adjusted EBITDA Margin 38.7% 2 Adjusted EBITDA Margin 19.2% Adjusted EBITDA Margin 23.8% Adjusted EBITDA Margin 35.4% • > 50% US supplier of • Leading catalyst supplier for • Lead bead supplier to NA, • Largest global supplier of regeneration demand hydrocracking sulfur removal Europe, Latin America sodium silicate • > 70% of regeneration • Supplier to top 3 NOx emission • Breadth of supply to diverse • > 70% sales contracted for contracts under 5 – 10 year control producers end markets 1 – 3 year terms take-or-pay terms • Specified with top silica • Pricing and cost protection • A large component of our North • ~90% costs protected with licensors & sole supplier to top enabled by transactional America material cost protected pass-through MMA producer volume and diverse customer with pass-through and market base Leading Furnace Technology / Material Science Capabilities / Global Operational Network (1) Includes Silica Catalysts and Zeolyst Joint Venture (2) Adjusted EBITDA margin includes proportionate 50% share of sales from Zeolyst Joint Venture 4OUR BUSINESS UNITS Specialty, Leading and Differentiated REFINING PERFORMANCE PERFORMANCE 1 CATALYSTS SERVICES MATERIALS CHEMICALS Increased octane Tighter fuels standards Higher highway Environmentally driven demand Light weighting demand safety standards consumer demand o Sulfuric acid production expertise o Tailored catalyst solutions o ~100 years glass technology leader o Silicate/Zeolite innovation o End-to-end logistics and services o Zeolite IP chemistry expertise o Innovation in microspheres o Tailored product sizing and coating and thermoplastics technology ($ MM) 2018 ($ MM) 2018 ($ MM) 2018 ($ MM) 2018 Silica Catalyst Sales 72.1 Sales 455.6 Sales 378.3 Sales 717.3 Zeolyst JV Sales 156.7 Adjusted EBITDA 176.5 Adjusted EBITDA 72.5 Adjusted EBITDA 170.9 Adjusted EBITDA 81.1 Adjusted EBITDA Margin 38.7% 2 Adjusted EBITDA Margin 19.2% Adjusted EBITDA Margin 23.8% Adjusted EBITDA Margin 35.4% • > 50% US supplier of • Leading catalyst supplier for • Lead bead supplier to NA, • Largest global supplier of regeneration demand hydrocracking sulfur removal Europe, Latin America sodium silicate • > 70% of regeneration • Supplier to top 3 NOx emission • Breadth of supply to diverse • > 70% sales contracted for contracts under 5 – 10 year control producers end markets 1 – 3 year terms take-or-pay terms • Specified with top silica • Pricing and cost protection • A large component of our North • ~90% costs protected with licensors & sole supplier to top enabled by transactional America material cost protected pass-through MMA producer volume and diverse customer with pass-through and market base Leading Furnace Technology / Material Science Capabilities / Global Operational Network (1) Includes Silica Catalysts and Zeolyst Joint Venture (2) Adjusted EBITDA margin includes proportionate 50% share of sales from Zeolyst Joint Venture 4
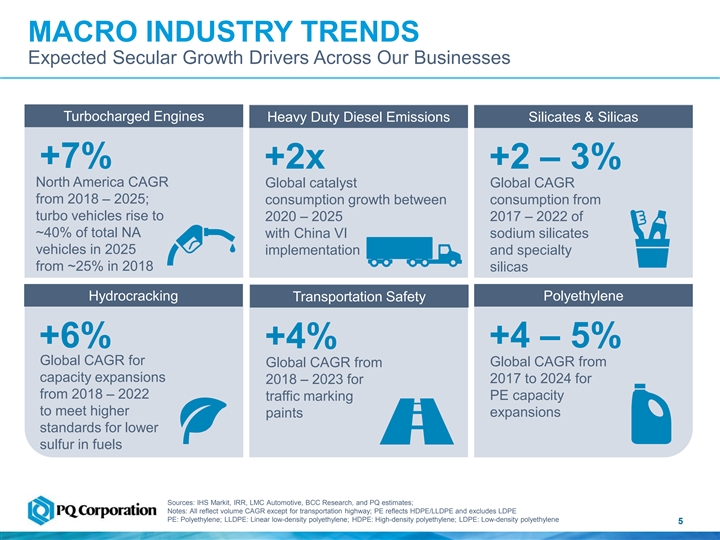
MACRO INDUSTRY TRENDS Expected Secular Growth Drivers Across Our Businesses Turbocharged Engines Heavy Duty Diesel Emissions Silicates & Silicas +7% +2x +2 – 3% North America CAGR Global catalyst Global CAGR from 2018 – 2025; consumption growth between consumption from turbo vehicles rise to 2020 – 2025 2017 – 2022 of ~40% of total NA with China VI sodium silicates vehicles in 2025 implementation and specialty from ~25% in 2018 silicas Hydrocracking Transportation Safety Polyethylene +6% +4% +4 – 5% Global CAGR for Global CAGR from Global CAGR from capacity expansions 2017 to 2024 for 2018 – 2023 for from 2018 – 2022 PE capacity traffic marking to meet higher expansions paints standards for lower sulfur in fuels Sources: IHS Markit, IRR, LMC Automotive, BCC Research, and PQ estimates; Notes: All reflect volume CAGR except for transportation highway; PE reflects HDPE/LLDPE and excludes LDPE PE: Polyethylene; LLDPE: Linear low-density polyethylene; HDPE: High-density polyethylene; LDPE: Low-density polyethylene 5MACRO INDUSTRY TRENDS Expected Secular Growth Drivers Across Our Businesses Turbocharged Engines Heavy Duty Diesel Emissions Silicates & Silicas +7% +2x +2 – 3% North America CAGR Global catalyst Global CAGR from 2018 – 2025; consumption growth between consumption from turbo vehicles rise to 2020 – 2025 2017 – 2022 of ~40% of total NA with China VI sodium silicates vehicles in 2025 implementation and specialty from ~25% in 2018 silicas Hydrocracking Transportation Safety Polyethylene +6% +4% +4 – 5% Global CAGR for Global CAGR from Global CAGR from capacity expansions 2017 to 2024 for 2018 – 2023 for from 2018 – 2022 PE capacity traffic marking to meet higher expansions paints standards for lower sulfur in fuels Sources: IHS Markit, IRR, LMC Automotive, BCC Research, and PQ estimates; Notes: All reflect volume CAGR except for transportation highway; PE reflects HDPE/LLDPE and excludes LDPE PE: Polyethylene; LLDPE: Linear low-density polyethylene; HDPE: High-density polyethylene; LDPE: Low-density polyethylene 5
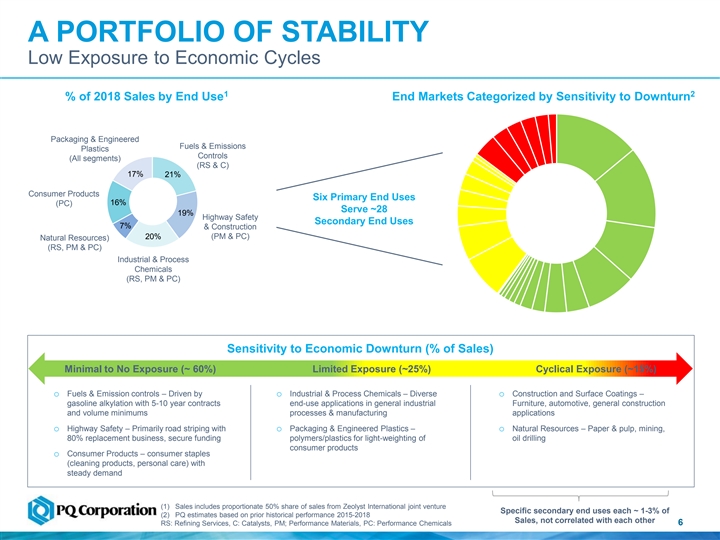
A PORTFOLIO OF STABILITY Low Exposure to Economic Cycles 1 2 % of 2018 Sales by End Use End Markets Categorized by Sensitivity to Downturn Packaging & Engineered Fuels & Emissions Plastics Controls (All segments) (RS & C) 17% 21% Consumer Products Six Primary End Uses 16% (PC) Serve ~28 19% Highway Safety Secondary End Uses 7% & Construction 20% (PM & PC) Natural Resources) (RS, PM & PC) Industrial & Process Chemicals (RS, PM & PC) Sensitivity to Economic Downturn (% of Sales) Minimal to No Exposure (~ 60%) Limited Exposure (~25%) Cyclical Exposure (~15%) o Fuels & Emission controls – Driven by o Industrial & Process Chemicals – Diverse o Construction and Surface Coatings – gasoline alkylation with 5-10 year contracts end-use applications in general industrial Furniture, automotive, general construction and volume minimums processes & manufacturing applications o Highway Safety – Primarily road striping with o Packaging & Engineered Plastics – o Natural Resources – Paper & pulp, mining, 80% replacement business, secure funding polymers/plastics for light-weighting of oil drilling consumer products o Consumer Products – consumer staples (cleaning products, personal care) with steady demand (1) Sales includes proportionate 50% share of sales from Zeolyst International joint venture Specific secondary end uses each ~ 1-3% of (2) PQ estimates based on prior historical performance 2015-2018 Sales, not correlated with each other 6 RS: Refining Services, C: Catalysts, PM; Performance Materials, PC: Performance ChemicalsA PORTFOLIO OF STABILITY Low Exposure to Economic Cycles 1 2 % of 2018 Sales by End Use End Markets Categorized by Sensitivity to Downturn Packaging & Engineered Fuels & Emissions Plastics Controls (All segments) (RS & C) 17% 21% Consumer Products Six Primary End Uses 16% (PC) Serve ~28 19% Highway Safety Secondary End Uses 7% & Construction 20% (PM & PC) Natural Resources) (RS, PM & PC) Industrial & Process Chemicals (RS, PM & PC) Sensitivity to Economic Downturn (% of Sales) Minimal to No Exposure (~ 60%) Limited Exposure (~25%) Cyclical Exposure (~15%) o Fuels & Emission controls – Driven by o Industrial & Process Chemicals – Diverse o Construction and Surface Coatings – gasoline alkylation with 5-10 year contracts end-use applications in general industrial Furniture, automotive, general construction and volume minimums processes & manufacturing applications o Highway Safety – Primarily road striping with o Packaging & Engineered Plastics – o Natural Resources – Paper & pulp, mining, 80% replacement business, secure funding polymers/plastics for light-weighting of oil drilling consumer products o Consumer Products – consumer staples (cleaning products, personal care) with steady demand (1) Sales includes proportionate 50% share of sales from Zeolyst International joint venture Specific secondary end uses each ~ 1-3% of (2) PQ estimates based on prior historical performance 2015-2018 Sales, not correlated with each other 6 RS: Refining Services, C: Catalysts, PM; Performance Materials, PC: Performance Chemicals
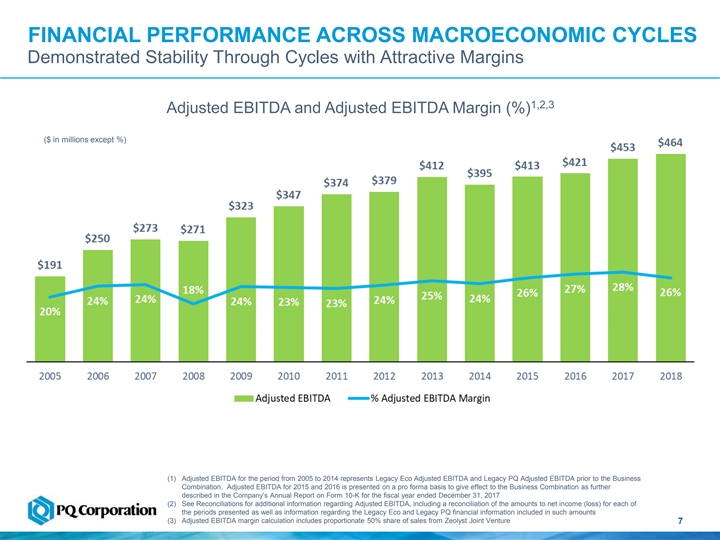
FINANCIAL PERFORMANCE ACROSS MACROECONOMIC CYCLES Demonstrated Stability Through Cycles with Attractive Margins 1,2,3 Adjusted EBITDA and Adjusted EBITDA Margin (%) ($ in millions except %) (1) Adjusted EBITDA for the period from 2005 to 2014 represents Legacy Eco Adjusted EBITDA and Legacy PQ Adjusted EBITDA prior to the Business Combination. Adjusted EBITDA for 2015 and 2016 is presented on a pro forma basis to give effect to the Business Combination as further described in the Company’s Annual Report on Form 10-K for the fiscal year ended December 31, 2017 (2) See Reconciliations for additional information regarding Adjusted EBITDA, including a reconciliation of the amounts to net income (loss) for each of the periods presented as well as information regarding the Legacy Eco and Legacy PQ financial information included in such amounts (3) Adjusted EBITDA margin calculation includes proportionate 50% share of sales from Zeolyst Joint Venture 7FINANCIAL PERFORMANCE ACROSS MACROECONOMIC CYCLES Demonstrated Stability Through Cycles with Attractive Margins 1,2,3 Adjusted EBITDA and Adjusted EBITDA Margin (%) ($ in millions except %) (1) Adjusted EBITDA for the period from 2005 to 2014 represents Legacy Eco Adjusted EBITDA and Legacy PQ Adjusted EBITDA prior to the Business Combination. Adjusted EBITDA for 2015 and 2016 is presented on a pro forma basis to give effect to the Business Combination as further described in the Company’s Annual Report on Form 10-K for the fiscal year ended December 31, 2017 (2) See Reconciliations for additional information regarding Adjusted EBITDA, including a reconciliation of the amounts to net income (loss) for each of the periods presented as well as information regarding the Legacy Eco and Legacy PQ financial information included in such amounts (3) Adjusted EBITDA margin calculation includes proportionate 50% share of sales from Zeolyst Joint Venture 7
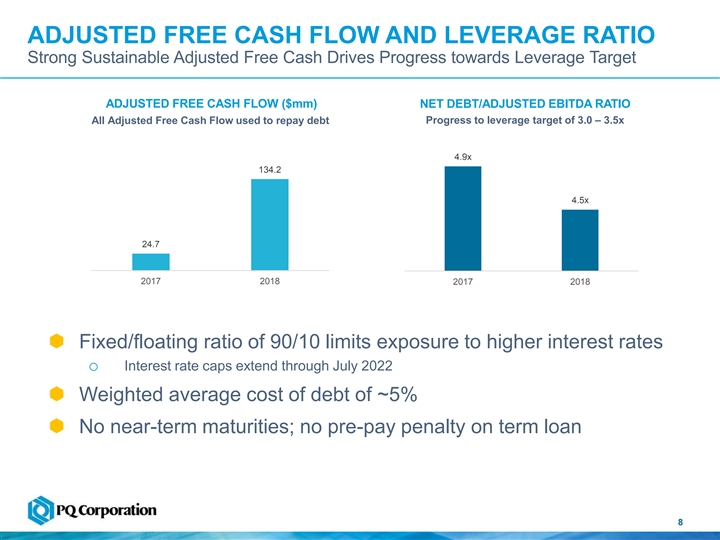
ADJUSTED FREE CASH FLOW AND LEVERAGE RATIO Strong Sustainable Adjusted Free Cash Drives Progress towards Leverage Target ADJUSTED FREE CASH FLOW ($mm) NET DEBT/ADJUSTED EBITDA RATIO All Adjusted Free Cash Flow used to repay debt Progress to leverage target of 3.0 – 3.5x 4.9x 134.2 4.5x 24.7 2017 2018 2017 2018 Fixed/floating ratio of 90/10 limits exposure to higher interest rates o Interest rate caps extend through July 2022 Weighted average cost of debt of ~5% No near-term maturities; no pre-pay penalty on term loan 8ADJUSTED FREE CASH FLOW AND LEVERAGE RATIO Strong Sustainable Adjusted Free Cash Drives Progress towards Leverage Target ADJUSTED FREE CASH FLOW ($mm) NET DEBT/ADJUSTED EBITDA RATIO All Adjusted Free Cash Flow used to repay debt Progress to leverage target of 3.0 – 3.5x 4.9x 134.2 4.5x 24.7 2017 2018 2017 2018 Fixed/floating ratio of 90/10 limits exposure to higher interest rates o Interest rate caps extend through July 2022 Weighted average cost of debt of ~5% No near-term maturities; no pre-pay penalty on term loan 8
SUPPLEMENTAL INFORMATIONSUPPLEMENTAL INFORMATION
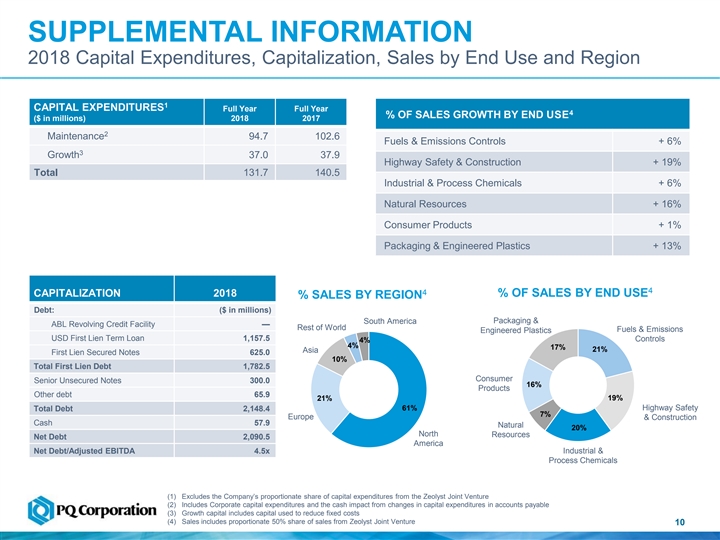
SUPPLEMENTAL INFORMATION 2018 Capital Expenditures, Capitalization, Sales by End Use and Region 1 CAPITAL EXPENDITURES Full Year Full Year 4 % OF SALES GROWTH BY END USE ($ in millions) 2018 2017 2 Maintenance 94.7 102.6 Fuels & Emissions Controls + 6% 3 Growth 37.0 37.9 Highway Safety & Construction + 19% Total 131.7 140.5 Industrial & Process Chemicals + 6% Natural Resources + 16% Consumer Products + 1% Packaging & Engineered Plastics + 13% 4 4 CAPITALIZATION 2018 % OF SALES BY END USE % SALES BY REGION Debt: ($ in millions) Packaging & South America ABL Revolving Credit Facility— Rest of World Fuels & Emissions Engineered Plastics USD First Lien Term Loan 1,157.5 Controls 4% 4% 17% 21% Asia First Lien Secured Notes 625.0 10% Total First Lien Debt 1,782.5 Consumer Senior Unsecured Notes 300.0 16% Products Other debt 65.9 21% 19% Total Debt 2,148.4 61% Highway Safety 7% Europe & Construction Cash 57.9 Natural 20% North Resources Net Debt 2,090.5 America Industrial & Net Debt/Adjusted EBITDA 4.5x Process Chemicals (1) Excludes the Company’s proportionate share of capital expenditures from the Zeolyst Joint Venture (2) Includes Corporate capital expenditures and the cash impact from changes in capital expenditures in accounts payable (3) Growth capital includes capital used to reduce fixed costs (4) Sales includes proportionate 50% share of sales from Zeolyst Joint Venture 10SUPPLEMENTAL INFORMATION 2018 Capital Expenditures, Capitalization, Sales by End Use and Region 1 CAPITAL EXPENDITURES Full Year Full Year 4 % OF SALES GROWTH BY END USE ($ in millions) 2018 2017 2 Maintenance 94.7 102.6 Fuels & Emissions Controls + 6% 3 Growth 37.0 37.9 Highway Safety & Construction + 19% Total 131.7 140.5 Industrial & Process Chemicals + 6% Natural Resources + 16% Consumer Products + 1% Packaging & Engineered Plastics + 13% 4 4 CAPITALIZATION 2018 % OF SALES BY END USE % SALES BY REGION Debt: ($ in millions) Packaging & South America ABL Revolving Credit Facility— Rest of World Fuels & Emissions Engineered Plastics USD First Lien Term Loan 1,157.5 Controls 4% 4% 17% 21% Asia First Lien Secured Notes 625.0 10% Total First Lien Debt 1,782.5 Consumer Senior Unsecured Notes 300.0 16% Products Other debt 65.9 21% 19% Total Debt 2,148.4 61% Highway Safety 7% Europe & Construction Cash 57.9 Natural 20% North Resources Net Debt 2,090.5 America Industrial & Net Debt/Adjusted EBITDA 4.5x Process Chemicals (1) Excludes the Company’s proportionate share of capital expenditures from the Zeolyst Joint Venture (2) Includes Corporate capital expenditures and the cash impact from changes in capital expenditures in accounts payable (3) Growth capital includes capital used to reduce fixed costs (4) Sales includes proportionate 50% share of sales from Zeolyst Joint Venture 10
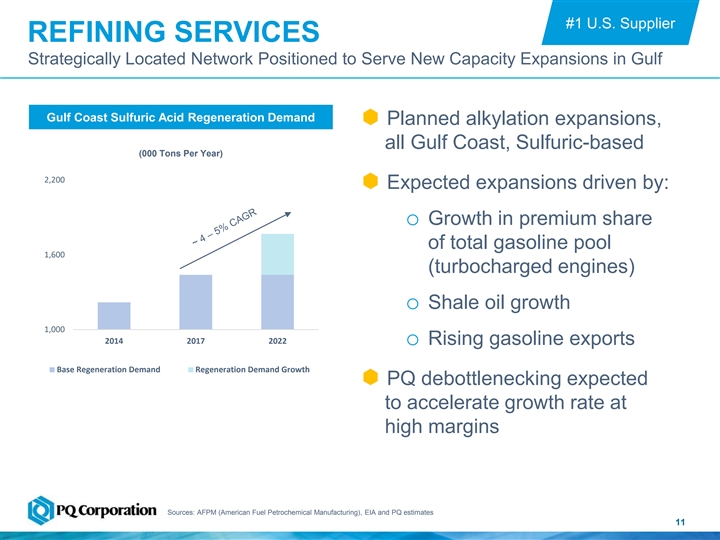
#1 U.S. Supplier REFINING SERVICES Strategically Located Network Positioned to Serve New Capacity Expansions in Gulf Gulf Coast Sulfuric Acid Regeneration Demand Planned alkylation expansions, all Gulf Coast, Sulfuric-based (000 Tons Per Year) 2,200 Expected expansions driven by: o Growth in premium share of total gasoline pool 1,600 (turbocharged engines) o Shale oil growth 1,000 2014 2017 2022 o Rising gasoline exports Base Regeneration Demand Regeneration Demand Growth PQ debottlenecking expected to accelerate growth rate at high margins Sources: AFPM (American Fuel Petrochemical Manufacturing), EIA and PQ estimates 11#1 U.S. Supplier REFINING SERVICES Strategically Located Network Positioned to Serve New Capacity Expansions in Gulf Gulf Coast Sulfuric Acid Regeneration Demand Planned alkylation expansions, all Gulf Coast, Sulfuric-based (000 Tons Per Year) 2,200 Expected expansions driven by: o Growth in premium share of total gasoline pool 1,600 (turbocharged engines) o Shale oil growth 1,000 2014 2017 2022 o Rising gasoline exports Base Regeneration Demand Regeneration Demand Growth PQ debottlenecking expected to accelerate growth rate at high margins Sources: AFPM (American Fuel Petrochemical Manufacturing), EIA and PQ estimates 11
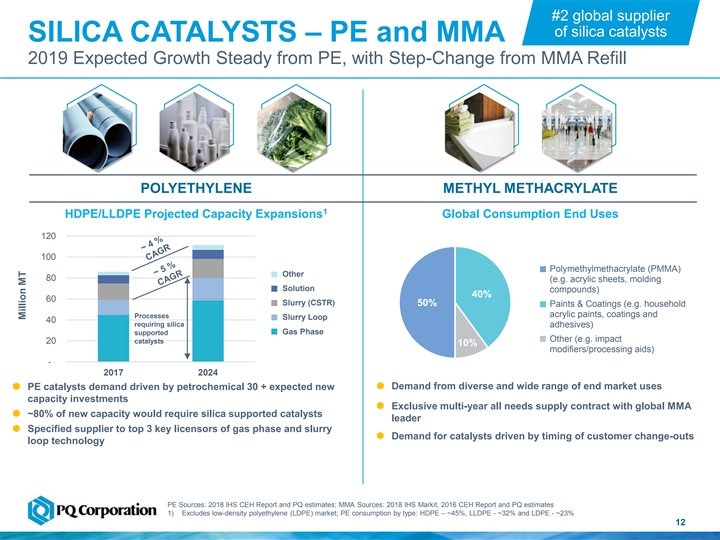
#2 global supplier of silica catalysts SILICA CATALYSTS – PE and MMA 2019 Expected Growth Steady from PE, with Step-Change from MMA Refill POLYETHYLENE METHYL METHACRYLATE 1 HDPE/LLDPE Projected Capacity Expansions Global Consumption End Uses 120 100 Polymethylmethacrylate (PMMA) Other 80 (e.g. acrylic sheets, molding Solution compounds) 40% 60 Slurry (CSTR) 50% Paints & Coatings (e.g. household acrylic paints, coatings and Processes Slurry Loop 40 requiring silica adhesives) Gas Phase supported Other (e.g. impact 20 catalysts 10% modifiers/processing aids) - 2017 2024 Demand from diverse and wide range of end market uses PE catalysts demand driven by petrochemical 30 + expected new capacity investments Exclusive multi-year all needs supply contract with global MMA ~80% of new capacity would require silica supported catalysts leader Specified supplier to top 3 key licensors of gas phase and slurry Demand for catalysts driven by timing of customer change-outs loop technology PE Sources: 2018 IHS CEH Report and PQ estimates; MMA Sources: 2018 IHS Markit, 2016 CEH Report and PQ estimates 1) Excludes low-density polyethylene (LDPE) market; PE consumption by type: HDPE – ~45%, LLDPE - ~32% and LDPE - ~23% 12 12 Million MT#2 global supplier of silica catalysts SILICA CATALYSTS – PE and MMA 2019 Expected Growth Steady from PE, with Step-Change from MMA Refill POLYETHYLENE METHYL METHACRYLATE 1 HDPE/LLDPE Projected Capacity Expansions Global Consumption End Uses 120 100 Polymethylmethacrylate (PMMA) Other 80 (e.g. acrylic sheets, molding Solution compounds) 40% 60 Slurry (CSTR) 50% Paints & Coatings (e.g. household acrylic paints, coatings and Processes Slurry Loop 40 requiring silica adhesives) Gas Phase supported Other (e.g. impact 20 catalysts 10% modifiers/processing aids) - 2017 2024 Demand from diverse and wide range of end market uses PE catalysts demand driven by petrochemical 30 + expected new capacity investments Exclusive multi-year all needs supply contract with global MMA ~80% of new capacity would require silica supported catalysts leader Specified supplier to top 3 key licensors of gas phase and slurry Demand for catalysts driven by timing of customer change-outs loop technology PE Sources: 2018 IHS CEH Report and PQ estimates; MMA Sources: 2018 IHS Markit, 2016 CEH Report and PQ estimates 1) Excludes low-density polyethylene (LDPE) market; PE consumption by type: HDPE – ~45%, LLDPE - ~32% and LDPE - ~23% 12 12 Million MT
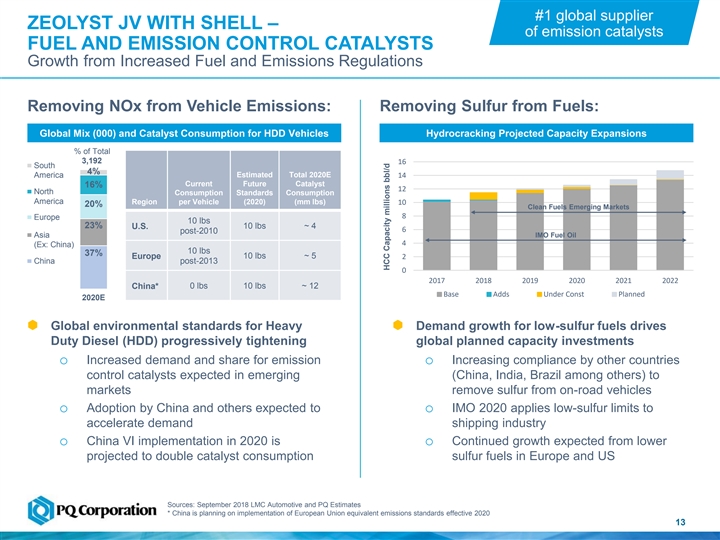
#1 global supplier ZEOLYST JV WITH SHELL – of emission catalysts FUEL AND EMISSION CONTROL CATALYSTS Growth from Increased Fuel and Emissions Regulations Removing NOx from Vehicle Emissions: Removing Sulfur from Fuels: Global Mix (000) and Catalyst Consumption for HDD Vehicles Hydrocracking Projected Capacity Expansions % of Total 3,192 16 South 4% Estimated Total 2020E America 14 Current Future Catalyst 16% 12 North Consumption Standards Consumption America Region per Vehicle (2020) (mm lbs) 10 20% Clean Fuels Emerging Markets 8 Europe 10 lbs 23% U.S. 10 lbs ~ 4 6 post-2010 Asia IMO Fuel Oil 4 (Ex: China) 10 lbs 37% Europe 10 lbs ~ 5 2 China post-2013 0 2017 2018 2019 2020 2021 2022 China* 0 lbs 10 lbs ~ 12 Base Adds Under Const Planned 2020E Global environmental standards for Heavy Demand growth for low-sulfur fuels drives Duty Diesel (HDD) progressively tightening global planned capacity investments o Increased demand and share for emission o Increasing compliance by other countries control catalysts expected in emerging (China, India, Brazil among others) to markets remove sulfur from on-road vehicles o Adoption by China and others expected to o IMO 2020 applies low-sulfur limits to accelerate demand shipping industry o China VI implementation in 2020 is o Continued growth expected from lower projected to double catalyst consumption sulfur fuels in Europe and US Sources: September 2018 LMC Automotive and PQ Estimates * China is planning on implementation of European Union equivalent emissions standards effective 2020 13 13 HCC Capacity millions bbl/d#1 global supplier ZEOLYST JV WITH SHELL – of emission catalysts FUEL AND EMISSION CONTROL CATALYSTS Growth from Increased Fuel and Emissions Regulations Removing NOx from Vehicle Emissions: Removing Sulfur from Fuels: Global Mix (000) and Catalyst Consumption for HDD Vehicles Hydrocracking Projected Capacity Expansions % of Total 3,192 16 South 4% Estimated Total 2020E America 14 Current Future Catalyst 16% 12 North Consumption Standards Consumption America Region per Vehicle (2020) (mm lbs) 10 20% Clean Fuels Emerging Markets 8 Europe 10 lbs 23% U.S. 10 lbs ~ 4 6 post-2010 Asia IMO Fuel Oil 4 (Ex: China) 10 lbs 37% Europe 10 lbs ~ 5 2 China post-2013 0 2017 2018 2019 2020 2021 2022 China* 0 lbs 10 lbs ~ 12 Base Adds Under Const Planned 2020E Global environmental standards for Heavy Demand growth for low-sulfur fuels drives Duty Diesel (HDD) progressively tightening global planned capacity investments o Increased demand and share for emission o Increasing compliance by other countries control catalysts expected in emerging (China, India, Brazil among others) to markets remove sulfur from on-road vehicles o Adoption by China and others expected to o IMO 2020 applies low-sulfur limits to accelerate demand shipping industry o China VI implementation in 2020 is o Continued growth expected from lower projected to double catalyst consumption sulfur fuels in Europe and US Sources: September 2018 LMC Automotive and PQ Estimates * China is planning on implementation of European Union equivalent emissions standards effective 2020 13 13 HCC Capacity millions bbl/d
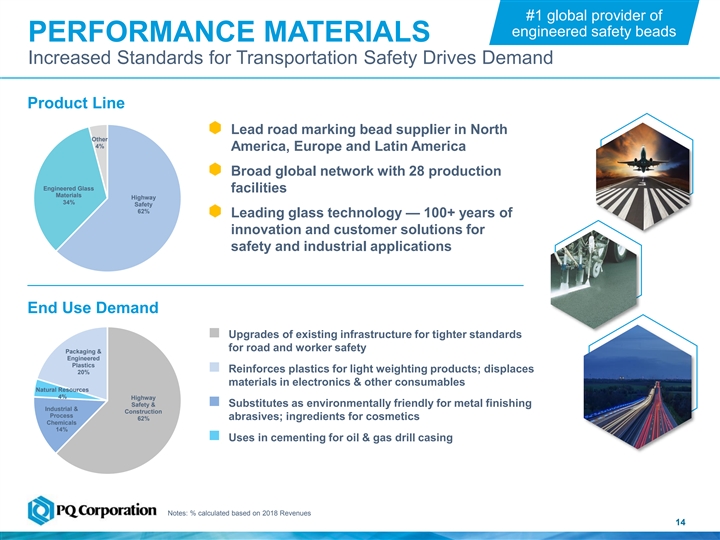
#1 global provider of engineered safety beads PERFORMANCE MATERIALS Increased Standards for Transportation Safety Drives Demand Product Line Lead road marking bead supplier in North Other 4% America, Europe and Latin America Broad global network with 28 production Engineered Glass facilities Materials Highway 34% Safety 62% Leading glass technology — 100+ years of innovation and customer solutions for safety and industrial applications End Use Demand Upgrades of existing infrastructure for tighter standards for road and worker safety Packaging & Engineered Plastics Reinforces plastics for light weighting products; displaces 20% materials in electronics & other consumables Natural Resources 4% Highway Safety & Substitutes as environmentally friendly for metal finishing Industrial & Construction Process abrasives; ingredients for cosmetics 62% Chemicals 14% Uses in cementing for oil & gas drill casing Notes: % calculated based on 2018 Revenues 14 14#1 global provider of engineered safety beads PERFORMANCE MATERIALS Increased Standards for Transportation Safety Drives Demand Product Line Lead road marking bead supplier in North Other 4% America, Europe and Latin America Broad global network with 28 production Engineered Glass facilities Materials Highway 34% Safety 62% Leading glass technology — 100+ years of innovation and customer solutions for safety and industrial applications End Use Demand Upgrades of existing infrastructure for tighter standards for road and worker safety Packaging & Engineered Plastics Reinforces plastics for light weighting products; displaces 20% materials in electronics & other consumables Natural Resources 4% Highway Safety & Substitutes as environmentally friendly for metal finishing Industrial & Construction Process abrasives; ingredients for cosmetics 62% Chemicals 14% Uses in cementing for oil & gas drill casing Notes: % calculated based on 2018 Revenues 14 14
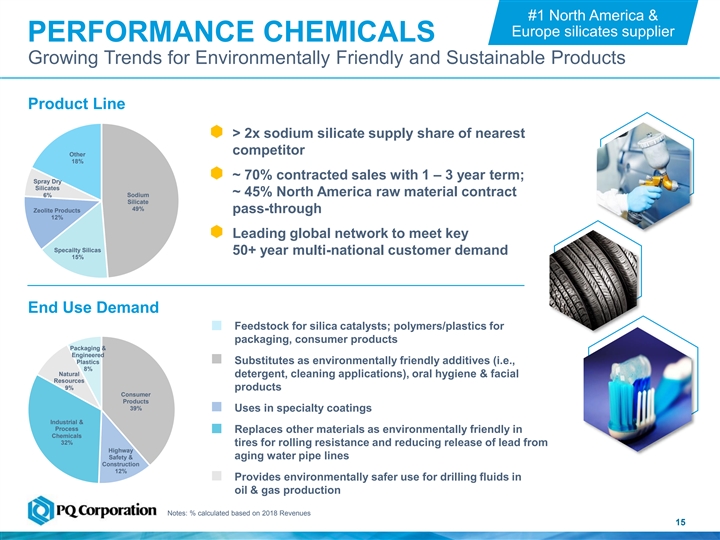
#1 North America & Europe silicates supplier PERFORMANCE CHEMICALS Growing Trends for Environmentally Friendly and Sustainable Products Product Line > 2x sodium silicate supply share of nearest competitor Other 18% ~ 70% contracted sales with 1 – 3 year term; Spray Dry Silicates ~ 45% North America raw material contract 6% Sodium Silicate 49% Zeolite Products pass-through 12% Leading global network to meet key Specailty Silicas 50+ year multi-national customer demand 15% End Use Demand Feedstock for silica catalysts; polymers/plastics for packaging, consumer products Packaging & Engineered Plastics Substitutes as environmentally friendly additives (i.e., 8% Natural detergent, cleaning applications), oral hygiene & facial Resources 9% products Consumer Products 39% Uses in specialty coatings Industrial & Process Replaces other materials as environmentally friendly in Chemicals 32% tires for rolling resistance and reducing release of lead from Highway Safety & aging water pipe lines Construction 12% Provides environmentally safer use for drilling fluids in oil & gas production Notes: % calculated based on 2018 Revenues 15 15#1 North America & Europe silicates supplier PERFORMANCE CHEMICALS Growing Trends for Environmentally Friendly and Sustainable Products Product Line > 2x sodium silicate supply share of nearest competitor Other 18% ~ 70% contracted sales with 1 – 3 year term; Spray Dry Silicates ~ 45% North America raw material contract 6% Sodium Silicate 49% Zeolite Products pass-through 12% Leading global network to meet key Specailty Silicas 50+ year multi-national customer demand 15% End Use Demand Feedstock for silica catalysts; polymers/plastics for packaging, consumer products Packaging & Engineered Plastics Substitutes as environmentally friendly additives (i.e., 8% Natural detergent, cleaning applications), oral hygiene & facial Resources 9% products Consumer Products 39% Uses in specialty coatings Industrial & Process Replaces other materials as environmentally friendly in Chemicals 32% tires for rolling resistance and reducing release of lead from Highway Safety & aging water pipe lines Construction 12% Provides environmentally safer use for drilling fluids in oil & gas production Notes: % calculated based on 2018 Revenues 15 15
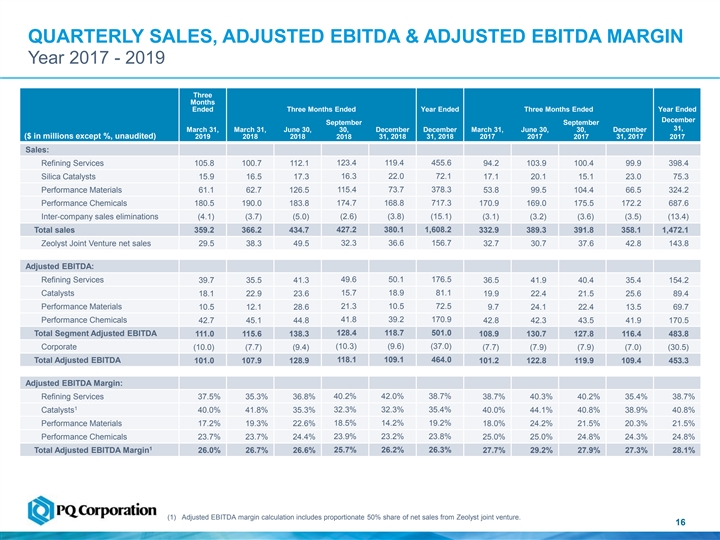
QUARTERLY SALES, ADJUSTED EBITDA & ADJUSTED EBITDA MARGIN Year 2017 - 2019 Three Months For the Quarter Ended Ended Three Months Ended Year Ended Three Months Ended Year Ended December September September 31, March 31, March 31, June 30, 30, December December March 31, June 30, 30, December ($ in millions except %, unaudited) 2019 2018 2018 2018 31, 2018 31, 2018 2017 2017 2017 31, 2017 2017 Sales: Refining Services 105.8 100.7 112.1 123.4 119.4 455.6 94.2 103.9 100.4 99.9 398.4 Silica Catalysts 15.9 16.5 17.3 16.3 22.0 72.1 17.1 20.1 15.1 23.0 75.3 115.4 73.7 378.3 Performance Materials 61.1 62.7 126.5 53.8 99.5 104.4 66.5 324.2 Performance Chemicals 180.5 190.0 183.8 174.7 168.8 717.3 170.9 169.0 175.5 172.2 687.6 Inter-company sales eliminations (4.1) (3.7) (5.0) (2.6) (3.8) (15.1) (3.1) (3.2) (3.6) (3.5) (13.4) 427.2 380.1 1,608.2 Total sales 359.2 366.2 434.7 332.9 389.3 391.8 358.1 1,472.1 Zeolyst Joint Venture net sales 29.5 38.3 49.5 32.3 36.6 156.7 32.7 30.7 37.6 42.8 143.8 Adjusted EBITDA: 49.6 50.1 176.5 Refining Services 39.7 35.5 41.3 36.5 41.9 40.4 35.4 154.2 Catalysts 18.1 22.9 23.6 15.7 18.9 81.1 19.9 22.4 21.5 25.6 89.4 Performance Materials 21.3 10.5 72.5 10.5 12.1 28.6 9.7 24.1 22.4 13.5 69.7 41.8 39.2 170.9 Performance Chemicals 42.7 45.1 44.8 42.8 42.3 43.5 41.9 170.5 Total Segment Adjusted EBITDA 128.4 118.7 501.0 111.0 115.6 138.3 108.9 130.7 127.8 116.4 483.8 (10.3) (9.6) (37.0) Corporate (10.0) (7.7) (9.4) (7.7) (7.9) (7.9) (7.0) (30.5) 118.1 109.1 464.0 Total Adjusted EBITDA 101.0 107.9 128.9 101.2 122.8 119.9 109.4 453.3 Adjusted EBITDA Margin: Refining Services 37.5% 35.3% 36.8% 40.2% 42.0% 38.7% 38.7% 40.3% 40.2% 35.4% 38.7% 1 32.3% 32.3% 35.4% Catalysts 40.0% 41.8% 35.3% 40.0% 44.1% 40.8% 38.9% 40.8% Performance Materials 17.2% 19.3% 22.6% 18.5% 14.2% 19.2% 18.0% 24.2% 21.5% 20.3% 21.5% 23.9% 23.2% 23.8% Performance Chemicals 23.7% 23.7% 24.4% 25.0% 25.0% 24.8% 24.3% 24.8% 1 Total Adjusted EBITDA Margin 26.0% 26.7% 26.6% 25.7% 26.2% 26.3% 27.7% 29.2% 27.9% 27.3% 28.1% (1) Adjusted EBITDA margin calculation includes proportionate 50% share of net sales from Zeolyst joint venture. 16QUARTERLY SALES, ADJUSTED EBITDA & ADJUSTED EBITDA MARGIN Year 2017 - 2019 Three Months For the Quarter Ended Ended Three Months Ended Year Ended Three Months Ended Year Ended December September September 31, March 31, March 31, June 30, 30, December December March 31, June 30, 30, December ($ in millions except %, unaudited) 2019 2018 2018 2018 31, 2018 31, 2018 2017 2017 2017 31, 2017 2017 Sales: Refining Services 105.8 100.7 112.1 123.4 119.4 455.6 94.2 103.9 100.4 99.9 398.4 Silica Catalysts 15.9 16.5 17.3 16.3 22.0 72.1 17.1 20.1 15.1 23.0 75.3 115.4 73.7 378.3 Performance Materials 61.1 62.7 126.5 53.8 99.5 104.4 66.5 324.2 Performance Chemicals 180.5 190.0 183.8 174.7 168.8 717.3 170.9 169.0 175.5 172.2 687.6 Inter-company sales eliminations (4.1) (3.7) (5.0) (2.6) (3.8) (15.1) (3.1) (3.2) (3.6) (3.5) (13.4) 427.2 380.1 1,608.2 Total sales 359.2 366.2 434.7 332.9 389.3 391.8 358.1 1,472.1 Zeolyst Joint Venture net sales 29.5 38.3 49.5 32.3 36.6 156.7 32.7 30.7 37.6 42.8 143.8 Adjusted EBITDA: 49.6 50.1 176.5 Refining Services 39.7 35.5 41.3 36.5 41.9 40.4 35.4 154.2 Catalysts 18.1 22.9 23.6 15.7 18.9 81.1 19.9 22.4 21.5 25.6 89.4 Performance Materials 21.3 10.5 72.5 10.5 12.1 28.6 9.7 24.1 22.4 13.5 69.7 41.8 39.2 170.9 Performance Chemicals 42.7 45.1 44.8 42.8 42.3 43.5 41.9 170.5 Total Segment Adjusted EBITDA 128.4 118.7 501.0 111.0 115.6 138.3 108.9 130.7 127.8 116.4 483.8 (10.3) (9.6) (37.0) Corporate (10.0) (7.7) (9.4) (7.7) (7.9) (7.9) (7.0) (30.5) 118.1 109.1 464.0 Total Adjusted EBITDA 101.0 107.9 128.9 101.2 122.8 119.9 109.4 453.3 Adjusted EBITDA Margin: Refining Services 37.5% 35.3% 36.8% 40.2% 42.0% 38.7% 38.7% 40.3% 40.2% 35.4% 38.7% 1 32.3% 32.3% 35.4% Catalysts 40.0% 41.8% 35.3% 40.0% 44.1% 40.8% 38.9% 40.8% Performance Materials 17.2% 19.3% 22.6% 18.5% 14.2% 19.2% 18.0% 24.2% 21.5% 20.3% 21.5% 23.9% 23.2% 23.8% Performance Chemicals 23.7% 23.7% 24.4% 25.0% 25.0% 24.8% 24.3% 24.8% 1 Total Adjusted EBITDA Margin 26.0% 26.7% 26.6% 25.7% 26.2% 26.3% 27.7% 29.2% 27.9% 27.3% 28.1% (1) Adjusted EBITDA margin calculation includes proportionate 50% share of net sales from Zeolyst joint venture. 16
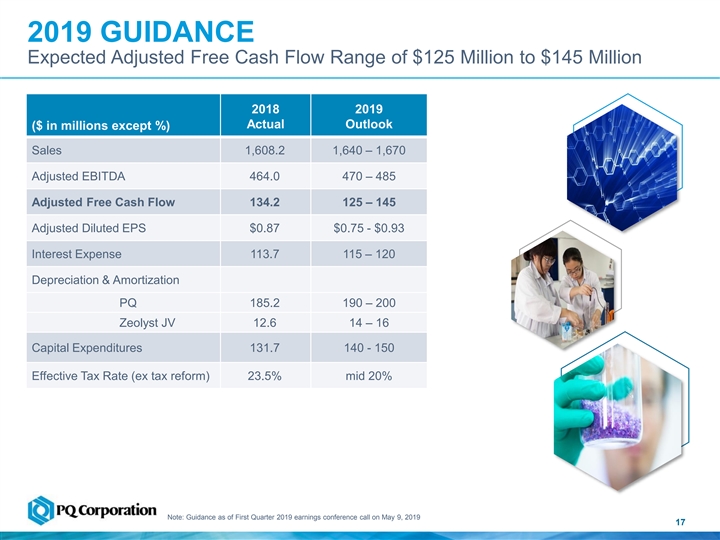
2019 GUIDANCE Expected Adjusted Free Cash Flow Range of $125 Million to $145 Million 2018 2019 Actual Outlook ($ in millions except %) Sales 1,608.2 1,640 – 1,670 Adjusted EBITDA 464.0 470 – 485 Adjusted Free Cash Flow 134.2 125 – 145 Adjusted Diluted EPS $0.87 $0.75 - $0.93 Interest Expense 113.7 115 – 120 Depreciation & Amortization PQ 185.2 190 – 200 Zeolyst JV 12.6 14 – 16 Capital Expenditures 131.7 140 - 150 Effective Tax Rate (ex tax reform) 23.5% mid 20% Note: Guidance as of First Quarter 2019 earnings conference call on May 9, 2019 172019 GUIDANCE Expected Adjusted Free Cash Flow Range of $125 Million to $145 Million 2018 2019 Actual Outlook ($ in millions except %) Sales 1,608.2 1,640 – 1,670 Adjusted EBITDA 464.0 470 – 485 Adjusted Free Cash Flow 134.2 125 – 145 Adjusted Diluted EPS $0.87 $0.75 - $0.93 Interest Expense 113.7 115 – 120 Depreciation & Amortization PQ 185.2 190 – 200 Zeolyst JV 12.6 14 – 16 Capital Expenditures 131.7 140 - 150 Effective Tax Rate (ex tax reform) 23.5% mid 20% Note: Guidance as of First Quarter 2019 earnings conference call on May 9, 2019 17
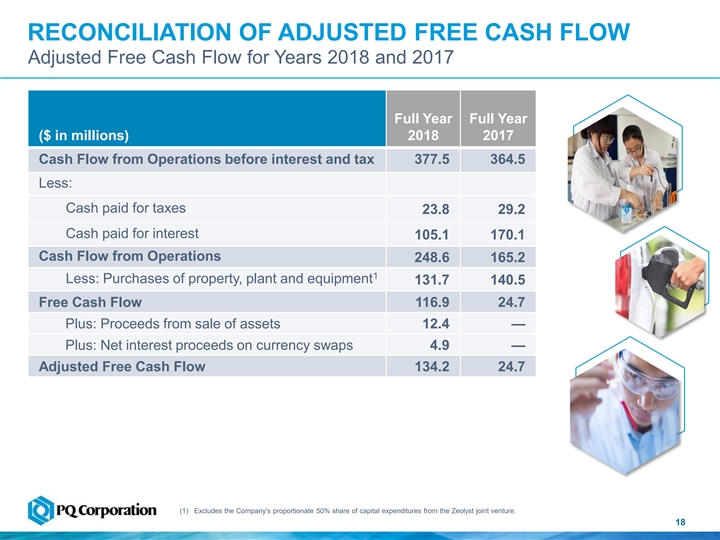
RECONCILIATION OF ADJUSTED FREE CASH FLOW Adjusted Free Cash Flow for Years 2018 and 2017 Full Year Full Year ($ in millions) 2018 2017 Cash Flow from Operations before interest and tax 377.5 364.5 Less: Cash paid for taxes 23.8 29.2 Cash paid for interest 105.1 170.1 Cash Flow from Operations 248.6 165.2 1 Less: Purchases of property, plant and equipment 131.7 140.5 Free Cash Flow 116.9 24.7 Plus: Proceeds from sale of assets 12.4— Plus: Net interest proceeds on currency swaps 4.9— Adjusted Free Cash Flow 134.2 24.7 (1) Excludes the Company’s proportionate 50% share of capital expenditures from the Zeolyst joint venture. 18RECONCILIATION OF ADJUSTED FREE CASH FLOW Adjusted Free Cash Flow for Years 2018 and 2017 Full Year Full Year ($ in millions) 2018 2017 Cash Flow from Operations before interest and tax 377.5 364.5 Less: Cash paid for taxes 23.8 29.2 Cash paid for interest 105.1 170.1 Cash Flow from Operations 248.6 165.2 1 Less: Purchases of property, plant and equipment 131.7 140.5 Free Cash Flow 116.9 24.7 Plus: Proceeds from sale of assets 12.4— Plus: Net interest proceeds on currency swaps 4.9— Adjusted Free Cash Flow 134.2 24.7 (1) Excludes the Company’s proportionate 50% share of capital expenditures from the Zeolyst joint venture. 18
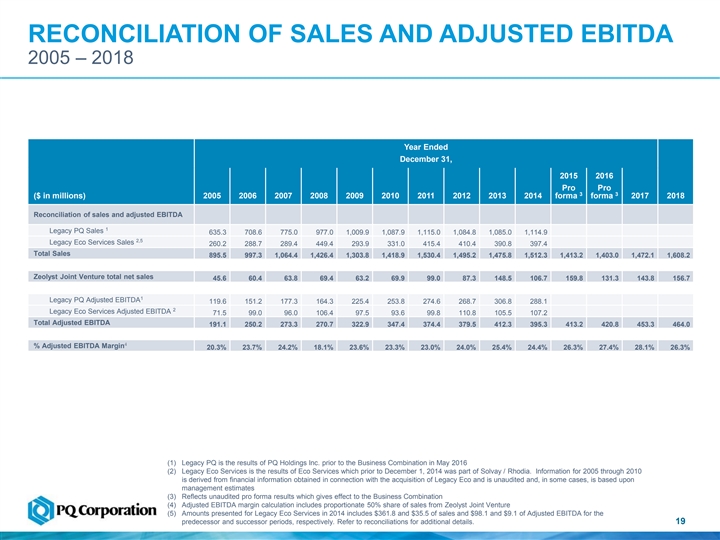
RECONCILIATION OF SALES AND ADJUSTED EBITDA 2005 – 2018 Year Ended December 31, 2015 2016 Pro Pro 3 3 forma forma ($ in millions) 2005 2006 2007 2008 2009 2010 2011 2012 2013 2014 2017 2018 Reconciliation of sales and adjusted EBITDA 1 Legacy PQ Sales 635.3 708.6 775.0 977.0 1,009.9 1,087.9 1,115.0 1,084.8 1,085.0 1,114.9 2,5 Legacy Eco Services Sales 260.2 288.7 289.4 449.4 293.9 331.0 415.4 410.4 390.8 397.4 Total Sales 895.5 997.3 1,064.4 1,426.4 1,303.8 1,418.9 1,530.4 1,495.2 1,475.8 1,512.3 1,413.2 1,403.0 1,472.1 1,608.2 Zeolyst Joint Venture total net sales 45.6 60.4 63.8 69.4 63.2 69.9 99.0 87.3 148.5 106.7 159.8 131.3 143.8 156.7 1 Legacy PQ Adjusted EBITDA 119.6 151.2 177.3 164.3 225.4 253.8 274.6 268.7 306.8 288.1 2 Legacy Eco Services Adjusted EBITDA 71.5 99.0 96.0 106.4 97.5 93.6 99.8 110.8 105.5 107.2 Total Adjusted EBITDA 191.1 250.2 273.3 270.7 322.9 347.4 374.4 379.5 412.3 395.3 413.2 420.8 453.3 464.0 4 % Adjusted EBITDA Margin 20.3% 23.7% 24.2% 18.1% 23.6% 23.3% 23.0% 24.0% 25.4% 24.4% 26.3% 27.4% 28.1% 26.3% (1) Legacy PQ is the results of PQ Holdings Inc. prior to the Business Combination in May 2016 (2) Legacy Eco Services is the results of Eco Services which prior to December 1, 2014 was part of Solvay / Rhodia. Information for 2005 through 2010 is derived from financial information obtained in connection with the acquisition of Legacy Eco and is unaudited and, in some cases, is based upon management estimates (3) Reflects unaudited pro forma results which gives effect to the Business Combination (4) Adjusted EBITDA margin calculation includes proportionate 50% share of sales from Zeolyst Joint Venture (5) Amounts presented for Legacy Eco Services in 2014 includes $361.8 and $35.5 of sales and $98.1 and $9.1 of Adjusted EBITDA for the predecessor and successor periods, respectively. Refer to reconciliations for additional details. 19RECONCILIATION OF SALES AND ADJUSTED EBITDA 2005 – 2018 Year Ended December 31, 2015 2016 Pro Pro 3 3 forma forma ($ in millions) 2005 2006 2007 2008 2009 2010 2011 2012 2013 2014 2017 2018 Reconciliation of sales and adjusted EBITDA 1 Legacy PQ Sales 635.3 708.6 775.0 977.0 1,009.9 1,087.9 1,115.0 1,084.8 1,085.0 1,114.9 2,5 Legacy Eco Services Sales 260.2 288.7 289.4 449.4 293.9 331.0 415.4 410.4 390.8 397.4 Total Sales 895.5 997.3 1,064.4 1,426.4 1,303.8 1,418.9 1,530.4 1,495.2 1,475.8 1,512.3 1,413.2 1,403.0 1,472.1 1,608.2 Zeolyst Joint Venture total net sales 45.6 60.4 63.8 69.4 63.2 69.9 99.0 87.3 148.5 106.7 159.8 131.3 143.8 156.7 1 Legacy PQ Adjusted EBITDA 119.6 151.2 177.3 164.3 225.4 253.8 274.6 268.7 306.8 288.1 2 Legacy Eco Services Adjusted EBITDA 71.5 99.0 96.0 106.4 97.5 93.6 99.8 110.8 105.5 107.2 Total Adjusted EBITDA 191.1 250.2 273.3 270.7 322.9 347.4 374.4 379.5 412.3 395.3 413.2 420.8 453.3 464.0 4 % Adjusted EBITDA Margin 20.3% 23.7% 24.2% 18.1% 23.6% 23.3% 23.0% 24.0% 25.4% 24.4% 26.3% 27.4% 28.1% 26.3% (1) Legacy PQ is the results of PQ Holdings Inc. prior to the Business Combination in May 2016 (2) Legacy Eco Services is the results of Eco Services which prior to December 1, 2014 was part of Solvay / Rhodia. Information for 2005 through 2010 is derived from financial information obtained in connection with the acquisition of Legacy Eco and is unaudited and, in some cases, is based upon management estimates (3) Reflects unaudited pro forma results which gives effect to the Business Combination (4) Adjusted EBITDA margin calculation includes proportionate 50% share of sales from Zeolyst Joint Venture (5) Amounts presented for Legacy Eco Services in 2014 includes $361.8 and $35.5 of sales and $98.1 and $9.1 of Adjusted EBITDA for the predecessor and successor periods, respectively. Refer to reconciliations for additional details. 19
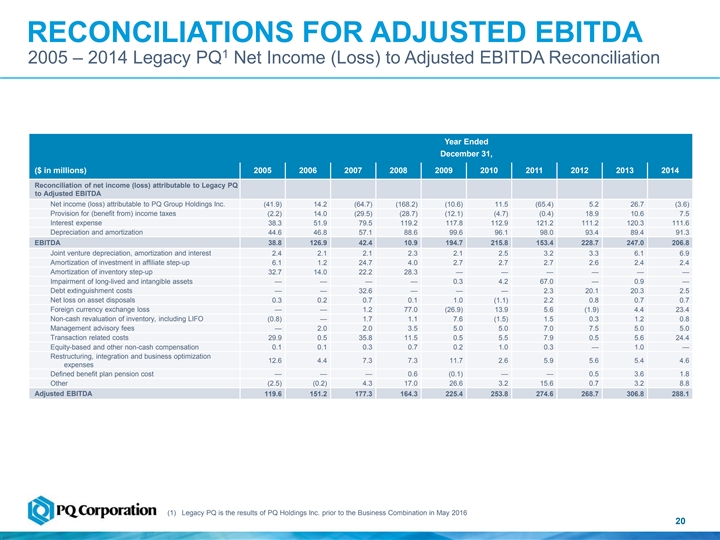
RECONCILIATIONS FOR ADJUSTED EBITDA 1 2005 – 2014 Legacy PQ Net Income (Loss) to Adjusted EBITDA Reconciliation Year Ended December 31, ($ in millions) 2005 2006 2007 2008 2009 2010 2011 2012 2013 2014 Reconciliation of net income (loss) attributable to Legacy PQ to Adjusted EBITDA Net income (loss) attributable to PQ Group Holdings Inc. (41.9) 14.2 (64.7) (168.2) (10.6) 11.5 (65.4) 5.2 26.7 (3.6) Provision for (benefit from) income taxes (2.2) 14.0 (29.5) (28.7) (12.1) (4.7) (0.4) 18.9 10.6 7.5 Interest expense 38.3 51.9 79.5 119.2 117.8 112.9 121.2 111.2 120.3 111.6 Depreciation and amortization 44.6 46.8 57.1 88.6 99.6 96.1 98.0 93.4 89.4 91.3 EBITDA 38.8 126.9 42.4 10.9 194.7 215.8 153.4 228.7 247.0 206.8 Joint venture depreciation, amortization and interest 2.4 2.1 2.1 2.3 2.1 2.5 3.2 3.3 6.1 6.9 Amortization of investment in affiliate step-up 6.1 1.2 24.7 4.0 2.7 2.7 2.7 2.6 2.4 2.4 Amortization of inventory step-up 32.7 14.0 22.2 28.3 — — — — — — Impairment of long-lived and intangible assets — — — — 0.3 4.2 67.0 — 0.9 — Debt extinguishment costs — — 32.6 — — — 2.3 20.1 20.3 2.5 Net loss on asset disposals 0.3 0.2 0.7 0.1 1.0 (1.1) 2.2 0.8 0.7 0.7 Foreign currency exchange loss — — 1.2 77.0 (26.9) 13.9 5.6 (1.9) 4.4 23.4 Non-cash revaluation of inventory, including LIFO (0.8) — 1.7 1.1 7.6 (1.5) 1.5 0.3 1.2 0.8 Management advisory fees — 2.0 2.0 3.5 5.0 5.0 7.0 7.5 5.0 5.0 Transaction related costs 29.9 0.5 35.8 11.5 0.5 5.5 7.9 0.5 5.6 24.4 Equity-based and other non-cash compensation 0.1 0.1 0.3 0.7 0.2 1.0 0.3 — 1.0 — Restructuring, integration and business optimization 12.6 4.4 7.3 7.3 11.7 2.6 5.9 5.6 5.4 4.6 expenses Defined benefit plan pension cost — — — 0.6 (0.1) — — 0.5 3.6 1.8 Other (2.5) (0.2) 4.3 17.0 26.6 3.2 15.6 0.7 3.2 8.8 Adjusted EBITDA 119.6 151.2 177.3 164.3 225.4 253.8 274.6 268.7 306.8 288.1 (1) Legacy PQ is the results of PQ Holdings Inc. prior to the Business Combination in May 2016 20RECONCILIATIONS FOR ADJUSTED EBITDA 1 2005 – 2014 Legacy PQ Net Income (Loss) to Adjusted EBITDA Reconciliation Year Ended December 31, ($ in millions) 2005 2006 2007 2008 2009 2010 2011 2012 2013 2014 Reconciliation of net income (loss) attributable to Legacy PQ to Adjusted EBITDA Net income (loss) attributable to PQ Group Holdings Inc. (41.9) 14.2 (64.7) (168.2) (10.6) 11.5 (65.4) 5.2 26.7 (3.6) Provision for (benefit from) income taxes (2.2) 14.0 (29.5) (28.7) (12.1) (4.7) (0.4) 18.9 10.6 7.5 Interest expense 38.3 51.9 79.5 119.2 117.8 112.9 121.2 111.2 120.3 111.6 Depreciation and amortization 44.6 46.8 57.1 88.6 99.6 96.1 98.0 93.4 89.4 91.3 EBITDA 38.8 126.9 42.4 10.9 194.7 215.8 153.4 228.7 247.0 206.8 Joint venture depreciation, amortization and interest 2.4 2.1 2.1 2.3 2.1 2.5 3.2 3.3 6.1 6.9 Amortization of investment in affiliate step-up 6.1 1.2 24.7 4.0 2.7 2.7 2.7 2.6 2.4 2.4 Amortization of inventory step-up 32.7 14.0 22.2 28.3 — — — — — — Impairment of long-lived and intangible assets — — — — 0.3 4.2 67.0 — 0.9 — Debt extinguishment costs — — 32.6 — — — 2.3 20.1 20.3 2.5 Net loss on asset disposals 0.3 0.2 0.7 0.1 1.0 (1.1) 2.2 0.8 0.7 0.7 Foreign currency exchange loss — — 1.2 77.0 (26.9) 13.9 5.6 (1.9) 4.4 23.4 Non-cash revaluation of inventory, including LIFO (0.8) — 1.7 1.1 7.6 (1.5) 1.5 0.3 1.2 0.8 Management advisory fees — 2.0 2.0 3.5 5.0 5.0 7.0 7.5 5.0 5.0 Transaction related costs 29.9 0.5 35.8 11.5 0.5 5.5 7.9 0.5 5.6 24.4 Equity-based and other non-cash compensation 0.1 0.1 0.3 0.7 0.2 1.0 0.3 — 1.0 — Restructuring, integration and business optimization 12.6 4.4 7.3 7.3 11.7 2.6 5.9 5.6 5.4 4.6 expenses Defined benefit plan pension cost — — — 0.6 (0.1) — — 0.5 3.6 1.8 Other (2.5) (0.2) 4.3 17.0 26.6 3.2 15.6 0.7 3.2 8.8 Adjusted EBITDA 119.6 151.2 177.3 164.3 225.4 253.8 274.6 268.7 306.8 288.1 (1) Legacy PQ is the results of PQ Holdings Inc. prior to the Business Combination in May 2016 20
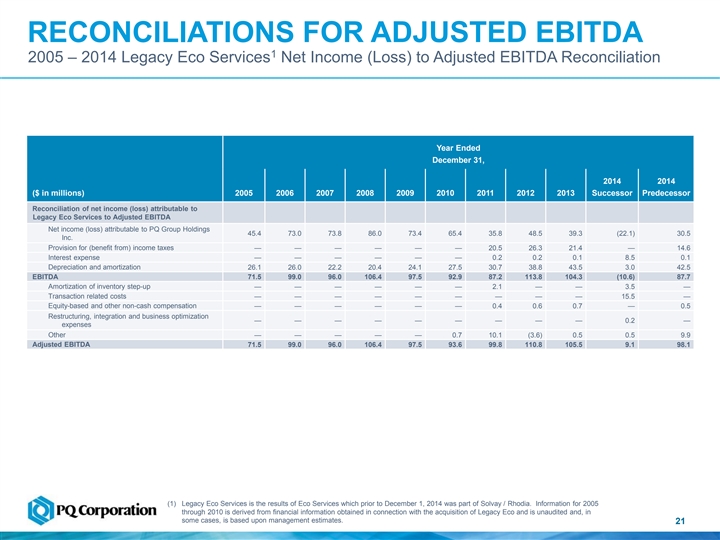
RECONCILIATIONS FOR ADJUSTED EBITDA 1 2005 – 2014 Legacy Eco Services Net Income (Loss) to Adjusted EBITDA Reconciliation Year Ended December 31, 2014 2014 ($ in millions) 2005 2006 2007 2008 2009 2010 2011 2012 2013 Successor Predecessor Reconciliation of net income (loss) attributable to Legacy Eco Services to Adjusted EBITDA Net income (loss) attributable to PQ Group Holdings 45.4 73.0 73.8 86.0 73.4 65.4 35.8 48.5 39.3 (22.1) 30.5 Inc. Provision for (benefit from) income taxes — — — — — — 20.5 26.3 21.4 — 14.6 Interest expense — — — — — — 0.2 0.2 0.1 8.5 0.1 Depreciation and amortization 26.1 26.0 22.2 20.4 24.1 27.5 30.7 38.8 43.5 3.0 42.5 EBITDA 71.5 99.0 96.0 106.4 97.5 92.9 87.2 113.8 104.3 (10.6) 87.7 Amortization of inventory step-up — — — — — — 2.1 — — 3.5 — Transaction related costs — — — — — — — — — 15.5 — Equity-based and other non-cash compensation — — — — — — 0.4 0.6 0.7 — 0.5 Restructuring, integration and business optimization — — — — — — — — — 0.2 — expenses Other — — — — — 0.7 10.1 (3.6) 0.5 0.5 9.9 Adjusted EBITDA 71.5 99.0 96.0 106.4 97.5 93.6 99.8 110.8 105.5 9.1 98.1 (1) Legacy Eco Services is the results of Eco Services which prior to December 1, 2014 was part of Solvay / Rhodia. Information for 2005 through 2010 is derived from financial information obtained in connection with the acquisition of Legacy Eco and is unaudited and, in some cases, is based upon management estimates. 21RECONCILIATIONS FOR ADJUSTED EBITDA 1 2005 – 2014 Legacy Eco Services Net Income (Loss) to Adjusted EBITDA Reconciliation Year Ended December 31, 2014 2014 ($ in millions) 2005 2006 2007 2008 2009 2010 2011 2012 2013 Successor Predecessor Reconciliation of net income (loss) attributable to Legacy Eco Services to Adjusted EBITDA Net income (loss) attributable to PQ Group Holdings 45.4 73.0 73.8 86.0 73.4 65.4 35.8 48.5 39.3 (22.1) 30.5 Inc. Provision for (benefit from) income taxes — — — — — — 20.5 26.3 21.4 — 14.6 Interest expense — — — — — — 0.2 0.2 0.1 8.5 0.1 Depreciation and amortization 26.1 26.0 22.2 20.4 24.1 27.5 30.7 38.8 43.5 3.0 42.5 EBITDA 71.5 99.0 96.0 106.4 97.5 92.9 87.2 113.8 104.3 (10.6) 87.7 Amortization of inventory step-up — — — — — — 2.1 — — 3.5 — Transaction related costs — — — — — — — — — 15.5 — Equity-based and other non-cash compensation — — — — — — 0.4 0.6 0.7 — 0.5 Restructuring, integration and business optimization — — — — — — — — — 0.2 — expenses Other — — — — — 0.7 10.1 (3.6) 0.5 0.5 9.9 Adjusted EBITDA 71.5 99.0 96.0 106.4 97.5 93.6 99.8 110.8 105.5 9.1 98.1 (1) Legacy Eco Services is the results of Eco Services which prior to December 1, 2014 was part of Solvay / Rhodia. Information for 2005 through 2010 is derived from financial information obtained in connection with the acquisition of Legacy Eco and is unaudited and, in some cases, is based upon management estimates. 21
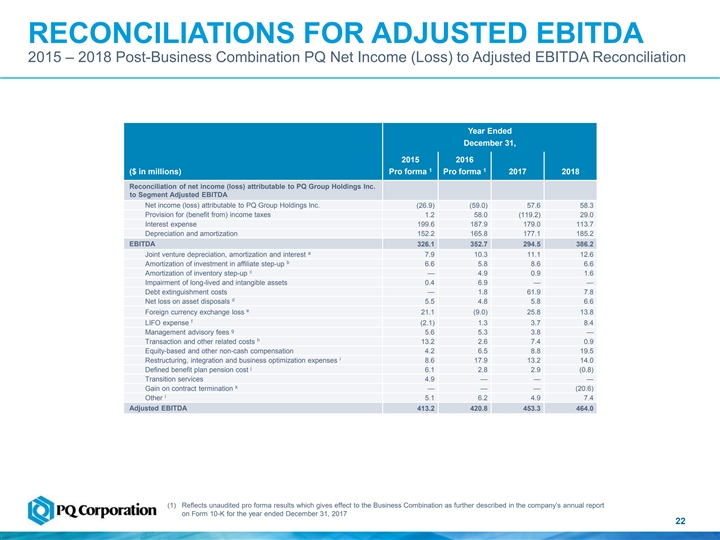
RECONCILIATIONS FOR ADJUSTED EBITDA 2015 – 2018 Post-Business Combination PQ Net Income (Loss) to Adjusted EBITDA Reconciliation Year Ended December 31, 2015 2016 1 1 ($ in millions) Pro forma Pro forma 2017 2018 Reconciliation of net income (loss) attributable to PQ Group Holdings Inc. to Segment Adjusted EBITDA Net income (loss) attributable to PQ Group Holdings Inc. (26.9) (59.0) 57.6 58.3 Provision for (benefit from) income taxes 1.2 58.0 (119.2) 29.0 Interest expense 199.6 187.9 179.0 113.7 Depreciation and amortization 152.2 165.8 177.1 185.2 EBITDA 326.1 352.7 294.5 386.2 a Joint venture depreciation, amortization and interest 7.9 10.3 11.1 12.6 b Amortization of investment in affiliate step-up 6.6 5.8 8.6 6.6 c Amortization of inventory step-up — 4.9 0.9 1.6 Impairment of long-lived and intangible assets 0.4 6.9 — — Debt extinguishment costs — 1.8 61.9 7.8 d Net loss on asset disposals 5.5 4.8 5.8 6.6 e Foreign currency exchange loss 21.1 (9.0) 25.8 13.8 f LIFO expense (2.1) 1.3 3.7 8.4 g Management advisory fees 5.6 5.3 3.8 — h Transaction and other related costs 13.2 2.6 7.4 0.9 Equity-based and other non-cash compensation 4.2 6.5 8.8 19.5 i Restructuring, integration and business optimization expenses 8.6 17.9 13.2 14.0 j Defined benefit plan pension cost 6.1 2.8 2.9 (0.8) Transition services 4.9 — — — k Gain on contract termination — — — (20.6) l Other 5.1 6.2 4.9 7.4 Adjusted EBITDA 413.2 420.8 453.3 464.0 (1) Reflects unaudited pro forma results which gives effect to the Business Combination as further described in the company’s annual report on Form 10-K for the year ended December 31, 2017 22RECONCILIATIONS FOR ADJUSTED EBITDA 2015 – 2018 Post-Business Combination PQ Net Income (Loss) to Adjusted EBITDA Reconciliation Year Ended December 31, 2015 2016 1 1 ($ in millions) Pro forma Pro forma 2017 2018 Reconciliation of net income (loss) attributable to PQ Group Holdings Inc. to Segment Adjusted EBITDA Net income (loss) attributable to PQ Group Holdings Inc. (26.9) (59.0) 57.6 58.3 Provision for (benefit from) income taxes 1.2 58.0 (119.2) 29.0 Interest expense 199.6 187.9 179.0 113.7 Depreciation and amortization 152.2 165.8 177.1 185.2 EBITDA 326.1 352.7 294.5 386.2 a Joint venture depreciation, amortization and interest 7.9 10.3 11.1 12.6 b Amortization of investment in affiliate step-up 6.6 5.8 8.6 6.6 c Amortization of inventory step-up — 4.9 0.9 1.6 Impairment of long-lived and intangible assets 0.4 6.9 — — Debt extinguishment costs — 1.8 61.9 7.8 d Net loss on asset disposals 5.5 4.8 5.8 6.6 e Foreign currency exchange loss 21.1 (9.0) 25.8 13.8 f LIFO expense (2.1) 1.3 3.7 8.4 g Management advisory fees 5.6 5.3 3.8 — h Transaction and other related costs 13.2 2.6 7.4 0.9 Equity-based and other non-cash compensation 4.2 6.5 8.8 19.5 i Restructuring, integration and business optimization expenses 8.6 17.9 13.2 14.0 j Defined benefit plan pension cost 6.1 2.8 2.9 (0.8) Transition services 4.9 — — — k Gain on contract termination — — — (20.6) l Other 5.1 6.2 4.9 7.4 Adjusted EBITDA 413.2 420.8 453.3 464.0 (1) Reflects unaudited pro forma results which gives effect to the Business Combination as further described in the company’s annual report on Form 10-K for the year ended December 31, 2017 22
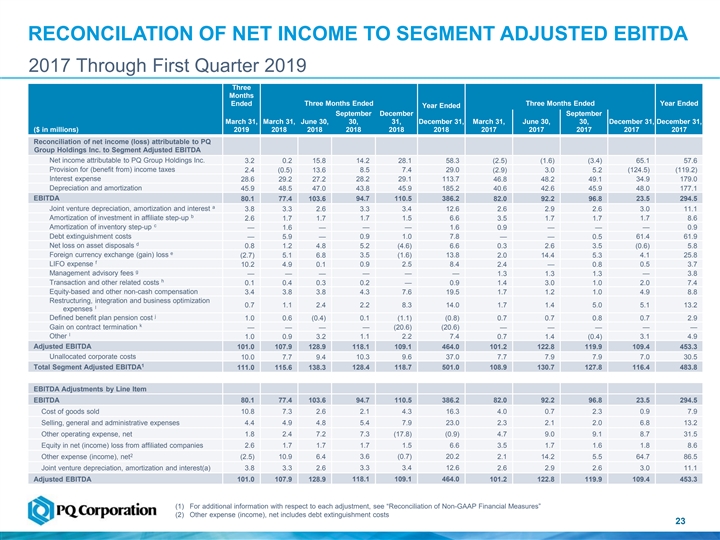
RECONCILATION OF NET INCOME TO SEGMENT ADJUSTED EBITDA 2017 Through First Quarter 2019 Three Months Ended Three Months Ended Three Months Ended Year Ended Year Ended September December September March 31, March 31, June 30, 30, 31, December 31, March 31, June 30, 30, December 31, December 31, ($ in millions) 2019 2018 2018 2018 2018 2018 2017 2017 2017 2017 2017 Reconciliation of net income (loss) attributable to PQ Group Holdings Inc. to Segment Adjusted EBITDA Net income attributable to PQ Group Holdings Inc. 3.2 0.2 15.8 14.2 28.1 58.3 (2.5) (1.6) (3.4) 65.1 57.6 Provision for (benefit from) income taxes 2.4 (0.5) 13.6 8.5 7.4 29.0 (2.9) 3.0 5.2 (124.5) (119.2) Interest expense 28.6 29.2 27.2 28.2 29.1 113.7 46.8 48.2 49.1 34.9 179.0 Depreciation and amortization 45.9 48.5 47.0 43.8 45.9 185.2 40.6 42.6 45.9 48.0 177.1 EBITDA 80.1 77.4 103.6 94.7 110.5 386.2 82.0 92.2 96.8 23.5 294.5 a Joint venture depreciation, amortization and interest 3.8 3.3 2.6 3.3 3.4 12.6 2.6 2.9 2.6 3.0 11.1 b Amortization of investment in affiliate step-up 2.6 1.7 1.7 1.7 1.5 6.6 3.5 1.7 1.7 1.7 8.6 c Amortization of inventory step-up — 1.6 — — — 1.6 0.9 — — — 0.9 Debt extinguishment costs — 5.9 — 0.9 1.0 7.8 — — 0.5 61.4 61.9 d Net loss on asset disposals 0.8 1.2 4.8 5.2 (4.6) 6.6 0.3 2.6 3.5 (0.6) 5.8 e Foreign currency exchange (gain) loss 3.5 (1.6) 13.8 4.1 25.8 (2.7) 5.1 6.8 2.0 14.4 5.3 f LIFO expense 10.2 4.9 0.1 0.9 2.5 8.4 2.4 — 0.8 0.5 3.7 g Management advisory fees — — — — — — 1.3 1.3 1.3 — 3.8 h Transaction and other related costs 0.1 0.4 0.3 0.2 — 0.9 1.4 3.0 1.0 2.0 7.4 Equity-based and other non-cash compensation 4.3 7.6 19.5 4.9 8.8 3.4 3.8 3.8 1.7 1.2 1.0 Restructuring, integration and business optimization 2.2 8.3 14.0 5.1 13.2 0.7 1.1 2.4 1.7 1.4 5.0 I expenses j Defined benefit plan pension cost 0.1 (1.1) (0.8) 0.7 2.9 1.0 0.6 (0.4) 0.7 0.7 0.8 k Gain on contract termination — — — — (20.6) (20.6) — — — — — l Other 1.0 0.9 3.2 1.1 2.2 7.4 0.7 1.4 (0.4) 3.1 4.9 Adjusted EBITDA 101.0 107.9 128.9 118.1 109.1 464.0 101.2 122.8 119.9 109.4 453.3 Unallocated corporate costs 10.3 9.6 37.0 7.7 7.9 7.9 7.0 30.5 10.0 7.7 9.4 1 Total Segment Adjusted EBITDA 111.0 115.6 138.3 128.4 118.7 501.0 108.9 130.7 127.8 116.4 483.8 EBITDA Adjustments by Line Item EBITDA 80.1 77.4 103.6 94.7 110.5 386.2 82.0 92.2 96.8 23.5 294.5 Cost of goods sold 10.8 7.3 2.6 2.1 4.3 16.3 4.0 0.7 2.3 0.9 7.9 Selling, general and administrative expenses 4.4 4.9 4.8 5.4 7.9 23.0 2.3 2.1 2.0 6.8 13.2 7.3 (17.8) (0.9) Other operating expense, net 1.8 2.4 7.2 4.7 9.0 9.1 8.7 31.5 Equity in net (income) loss from affiliated companies 2.6 1.7 1.7 1.7 1.5 6.6 3.5 1.7 1.6 1.8 8.6 2 Other expense (income), net (2.5) 10.9 6.4 3.6 (0.7) 20.2 2.1 14.2 5.5 64.7 86.5 Joint venture depreciation, amortization and interest(a) 3.8 3.3 2.6 3.3 3.4 12.6 2.6 2.9 2.6 3.0 11.1 Adjusted EBITDA 101.0 107.9 128.9 118.1 109.1 464.0 101.2 122.8 119.9 109.4 453.3 (1) For additional information with respect to each adjustment, see “Reconciliation of Non-GAAP Financial Measures” (2) Other expense (income), net includes debt extinguishment costs 23RECONCILATION OF NET INCOME TO SEGMENT ADJUSTED EBITDA 2017 Through First Quarter 2019 Three Months Ended Three Months Ended Three Months Ended Year Ended Year Ended September December September March 31, March 31, June 30, 30, 31, December 31, March 31, June 30, 30, December 31, December 31, ($ in millions) 2019 2018 2018 2018 2018 2018 2017 2017 2017 2017 2017 Reconciliation of net income (loss) attributable to PQ Group Holdings Inc. to Segment Adjusted EBITDA Net income attributable to PQ Group Holdings Inc. 3.2 0.2 15.8 14.2 28.1 58.3 (2.5) (1.6) (3.4) 65.1 57.6 Provision for (benefit from) income taxes 2.4 (0.5) 13.6 8.5 7.4 29.0 (2.9) 3.0 5.2 (124.5) (119.2) Interest expense 28.6 29.2 27.2 28.2 29.1 113.7 46.8 48.2 49.1 34.9 179.0 Depreciation and amortization 45.9 48.5 47.0 43.8 45.9 185.2 40.6 42.6 45.9 48.0 177.1 EBITDA 80.1 77.4 103.6 94.7 110.5 386.2 82.0 92.2 96.8 23.5 294.5 a Joint venture depreciation, amortization and interest 3.8 3.3 2.6 3.3 3.4 12.6 2.6 2.9 2.6 3.0 11.1 b Amortization of investment in affiliate step-up 2.6 1.7 1.7 1.7 1.5 6.6 3.5 1.7 1.7 1.7 8.6 c Amortization of inventory step-up — 1.6 — — — 1.6 0.9 — — — 0.9 Debt extinguishment costs — 5.9 — 0.9 1.0 7.8 — — 0.5 61.4 61.9 d Net loss on asset disposals 0.8 1.2 4.8 5.2 (4.6) 6.6 0.3 2.6 3.5 (0.6) 5.8 e Foreign currency exchange (gain) loss 3.5 (1.6) 13.8 4.1 25.8 (2.7) 5.1 6.8 2.0 14.4 5.3 f LIFO expense 10.2 4.9 0.1 0.9 2.5 8.4 2.4 — 0.8 0.5 3.7 g Management advisory fees — — — — — — 1.3 1.3 1.3 — 3.8 h Transaction and other related costs 0.1 0.4 0.3 0.2 — 0.9 1.4 3.0 1.0 2.0 7.4 Equity-based and other non-cash compensation 4.3 7.6 19.5 4.9 8.8 3.4 3.8 3.8 1.7 1.2 1.0 Restructuring, integration and business optimization 2.2 8.3 14.0 5.1 13.2 0.7 1.1 2.4 1.7 1.4 5.0 I expenses j Defined benefit plan pension cost 0.1 (1.1) (0.8) 0.7 2.9 1.0 0.6 (0.4) 0.7 0.7 0.8 k Gain on contract termination — — — — (20.6) (20.6) — — — — — l Other 1.0 0.9 3.2 1.1 2.2 7.4 0.7 1.4 (0.4) 3.1 4.9 Adjusted EBITDA 101.0 107.9 128.9 118.1 109.1 464.0 101.2 122.8 119.9 109.4 453.3 Unallocated corporate costs 10.3 9.6 37.0 7.7 7.9 7.9 7.0 30.5 10.0 7.7 9.4 1 Total Segment Adjusted EBITDA 111.0 115.6 138.3 128.4 118.7 501.0 108.9 130.7 127.8 116.4 483.8 EBITDA Adjustments by Line Item EBITDA 80.1 77.4 103.6 94.7 110.5 386.2 82.0 92.2 96.8 23.5 294.5 Cost of goods sold 10.8 7.3 2.6 2.1 4.3 16.3 4.0 0.7 2.3 0.9 7.9 Selling, general and administrative expenses 4.4 4.9 4.8 5.4 7.9 23.0 2.3 2.1 2.0 6.8 13.2 7.3 (17.8) (0.9) Other operating expense, net 1.8 2.4 7.2 4.7 9.0 9.1 8.7 31.5 Equity in net (income) loss from affiliated companies 2.6 1.7 1.7 1.7 1.5 6.6 3.5 1.7 1.6 1.8 8.6 2 Other expense (income), net (2.5) 10.9 6.4 3.6 (0.7) 20.2 2.1 14.2 5.5 64.7 86.5 Joint venture depreciation, amortization and interest(a) 3.8 3.3 2.6 3.3 3.4 12.6 2.6 2.9 2.6 3.0 11.1 Adjusted EBITDA 101.0 107.9 128.9 118.1 109.1 464.0 101.2 122.8 119.9 109.4 453.3 (1) For additional information with respect to each adjustment, see “Reconciliation of Non-GAAP Financial Measures” (2) Other expense (income), net includes debt extinguishment costs 23
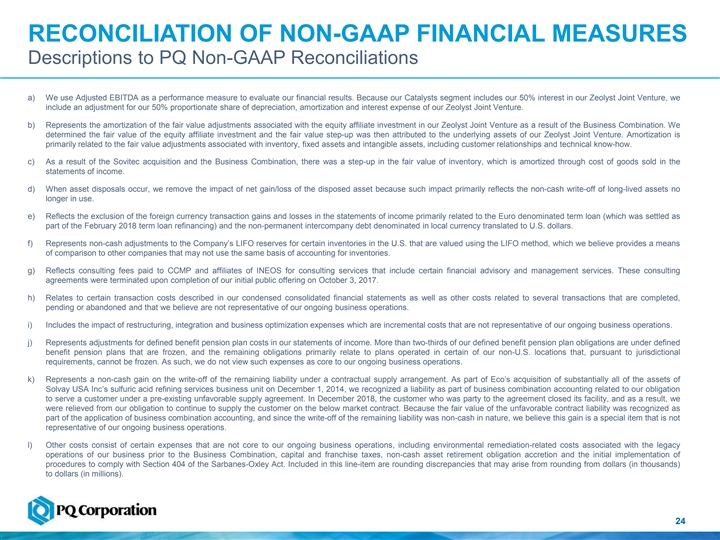
RECONCILIATION OF NON-GAAP FINANCIAL MEASURES Descriptions to PQ Non-GAAP Reconciliations a) We use Adjusted EBITDA as a performance measure to evaluate our financial results. Because our Catalysts segment includes our 50% interest in our Zeolyst Joint Venture, we include an adjustment for our 50% proportionate share of depreciation, amortization and interest expense of our Zeolyst Joint Venture. b) Represents the amortization of the fair value adjustments associated with the equity affiliate investment in our Zeolyst Joint Venture as a result of the Business Combination. We determined the fair value of the equity affiliate investment and the fair value step-up was then attributed to the underlying assets of our Zeolyst Joint Venture. Amortization is primarily related to the fair value adjustments associated with inventory, fixed assets and intangible assets, including customer relationships and technical know-how. c) As a result of the Sovitec acquisition and the Business Combination, there was a step-up in the fair value of inventory, which is amortized through cost of goods sold in the statements of income. d) When asset disposals occur, we remove the impact of net gain/loss of the disposed asset because such impact primarily reflects the non-cash write-off of long-lived assets no longer in use. e) Reflects the exclusion of the foreign currency transaction gains and losses in the statements of income primarily related to the Euro denominated term loan (which was settled as part of the February 2018 term loan refinancing) and the non-permanent intercompany debt denominated in local currency translated to U.S. dollars. f) Represents non-cash adjustments to the Company’s LIFO reserves for certain inventories in the U.S. that are valued using the LIFO method, which we believe provides a means of comparison to other companies that may not use the same basis of accounting for inventories. g) Reflects consulting fees paid to CCMP and affiliates of INEOS for consulting services that include certain financial advisory and management services. These consulting agreements were terminated upon completion of our initial public offering on October 3, 2017. h) Relates to certain transaction costs described in our condensed consolidated financial statements as well as other costs related to several transactions that are completed, pending or abandoned and that we believe are not representative of our ongoing business operations. i) Includes the impact of restructuring, integration and business optimization expenses which are incremental costs that are not representative of our ongoing business operations. j) Represents adjustments for defined benefit pension plan costs in our statements of income. More than two-thirds of our defined benefit pension plan obligations are under defined benefit pension plans that are frozen, and the remaining obligations primarily relate to plans operated in certain of our non-U.S. locations that, pursuant to jurisdictional requirements, cannot be frozen. As such, we do not view such expenses as core to our ongoing business operations. k) Represents a non-cash gain on the write-off of the remaining liability under a contractual supply arrangement. As part of Eco’s acquisition of substantially all of the assets of Solvay USA Inc’s sulfuric acid refining services business unit on December 1, 2014, we recognized a liability as part of business combination accounting related to our obligation to serve a customer under a pre-existing unfavorable supply agreement. In December 2018, the customer who was party to the agreement closed its facility, and as a result, we were relieved from our obligation to continue to supply the customer on the below market contract. Because the fair value of the unfavorable contract liability was recognized as part of the application of business combination accounting, and since the write-off of the remaining liability was non-cash in nature, we believe this gain is a special item that is not representative of our ongoing business operations. l) Other costs consist of certain expenses that are not core to our ongoing business operations, including environmental remediation-related costs associated with the legacy operations of our business prior to the Business Combination, capital and franchise taxes, non-cash asset retirement obligation accretion and the initial implementation of procedures to comply with Section 404 of the Sarbanes-Oxley Act. Included in this line-item are rounding discrepancies that may arise from rounding from dollars (in thousands) to dollars (in millions). 24RECONCILIATION OF NON-GAAP FINANCIAL MEASURES Descriptions to PQ Non-GAAP Reconciliations a) We use Adjusted EBITDA as a performance measure to evaluate our financial results. Because our Catalysts segment includes our 50% interest in our Zeolyst Joint Venture, we include an adjustment for our 50% proportionate share of depreciation, amortization and interest expense of our Zeolyst Joint Venture. b) Represents the amortization of the fair value adjustments associated with the equity affiliate investment in our Zeolyst Joint Venture as a result of the Business Combination. We determined the fair value of the equity affiliate investment and the fair value step-up was then attributed to the underlying assets of our Zeolyst Joint Venture. Amortization is primarily related to the fair value adjustments associated with inventory, fixed assets and intangible assets, including customer relationships and technical know-how. c) As a result of the Sovitec acquisition and the Business Combination, there was a step-up in the fair value of inventory, which is amortized through cost of goods sold in the statements of income. d) When asset disposals occur, we remove the impact of net gain/loss of the disposed asset because such impact primarily reflects the non-cash write-off of long-lived assets no longer in use. e) Reflects the exclusion of the foreign currency transaction gains and losses in the statements of income primarily related to the Euro denominated term loan (which was settled as part of the February 2018 term loan refinancing) and the non-permanent intercompany debt denominated in local currency translated to U.S. dollars. f) Represents non-cash adjustments to the Company’s LIFO reserves for certain inventories in the U.S. that are valued using the LIFO method, which we believe provides a means of comparison to other companies that may not use the same basis of accounting for inventories. g) Reflects consulting fees paid to CCMP and affiliates of INEOS for consulting services that include certain financial advisory and management services. These consulting agreements were terminated upon completion of our initial public offering on October 3, 2017. h) Relates to certain transaction costs described in our condensed consolidated financial statements as well as other costs related to several transactions that are completed, pending or abandoned and that we believe are not representative of our ongoing business operations. i) Includes the impact of restructuring, integration and business optimization expenses which are incremental costs that are not representative of our ongoing business operations. j) Represents adjustments for defined benefit pension plan costs in our statements of income. More than two-thirds of our defined benefit pension plan obligations are under defined benefit pension plans that are frozen, and the remaining obligations primarily relate to plans operated in certain of our non-U.S. locations that, pursuant to jurisdictional requirements, cannot be frozen. As such, we do not view such expenses as core to our ongoing business operations. k) Represents a non-cash gain on the write-off of the remaining liability under a contractual supply arrangement. As part of Eco’s acquisition of substantially all of the assets of Solvay USA Inc’s sulfuric acid refining services business unit on December 1, 2014, we recognized a liability as part of business combination accounting related to our obligation to serve a customer under a pre-existing unfavorable supply agreement. In December 2018, the customer who was party to the agreement closed its facility, and as a result, we were relieved from our obligation to continue to supply the customer on the below market contract. Because the fair value of the unfavorable contract liability was recognized as part of the application of business combination accounting, and since the write-off of the remaining liability was non-cash in nature, we believe this gain is a special item that is not representative of our ongoing business operations. l) Other costs consist of certain expenses that are not core to our ongoing business operations, including environmental remediation-related costs associated with the legacy operations of our business prior to the Business Combination, capital and franchise taxes, non-cash asset retirement obligation accretion and the initial implementation of procedures to comply with Section 404 of the Sarbanes-Oxley Act. Included in this line-item are rounding discrepancies that may arise from rounding from dollars (in thousands) to dollars (in millions). 24
2525